
Parallel Coordinates Plot
On this page
Purpose
The Parallel Coordinates Plot draws one vertical axis per variable and each row of data as a line that crosses every axis at its value. You can follow a single batch, part or run through all its measurements at once and see which variables move together. Use it when you have several measurements per unit and want to find patterns across all of them: which high-strength batches also have low elongation, or what the worst units have in common.
Key Capabilities
- Three or more numeric variables, drawn as axes from left to right in the order you select them.
- One line per row; lines can be coloured by a numeric column with a colour scale (Viridis) and a colour bar.
- Interactive: drag along an axis to highlight only the lines in a range, and drag an axis sideways to change the order.
- Each axis has its own scale, from the minimum to the maximum of that variable, so variables in different units can be compared.
Statistical Methods
Rows with a non-numeric or blank value in any selected variable are left out, so every line crosses every axis. Each axis runs from the smallest to the largest value of its variable; a line's height on an axis is therefore its position within that variable's range, not an absolute value. When colouring is set, each line takes the colour of its value in the Color by column on a continuous scale, with dark purple for the lowest and yellow for the highest values.
How to read it: between two neighbouring axes, lines that run roughly parallel mean the two variables rise and fall together (positive correlation); lines that cross in an X shape mean one rises as the other falls (negative correlation); a tangle with no pattern means little relationship. Only neighbouring axes can be compared directly, so the order of the variables matters. Groups of lines that follow the same path show clusters, and a line that leaves the bundle is an unusual unit worth checking.
The plot computes no statistics. Use Correlation or the Matrix Plot to put numbers on the pairwise relationships.
Input Fields & Options
Field | Description |
Variables | Required. Select 3 or more numeric columns, in the order they should appear left to right. |
Color by | Optional. A numeric column to colour the lines by. Categorical colouring is not supported. Default “--”: all lines in one colour. |
Title | Title of the plot. Default “Parallel Coordinates Plot”. |
Data Options: Subset (optional) | Exclude matching rows (default) or Include only matching rows; Row numbers (e.g. 3,7,12-15) and/or a Condition (e.g. Batch_Type == "Premium") select the rows. |
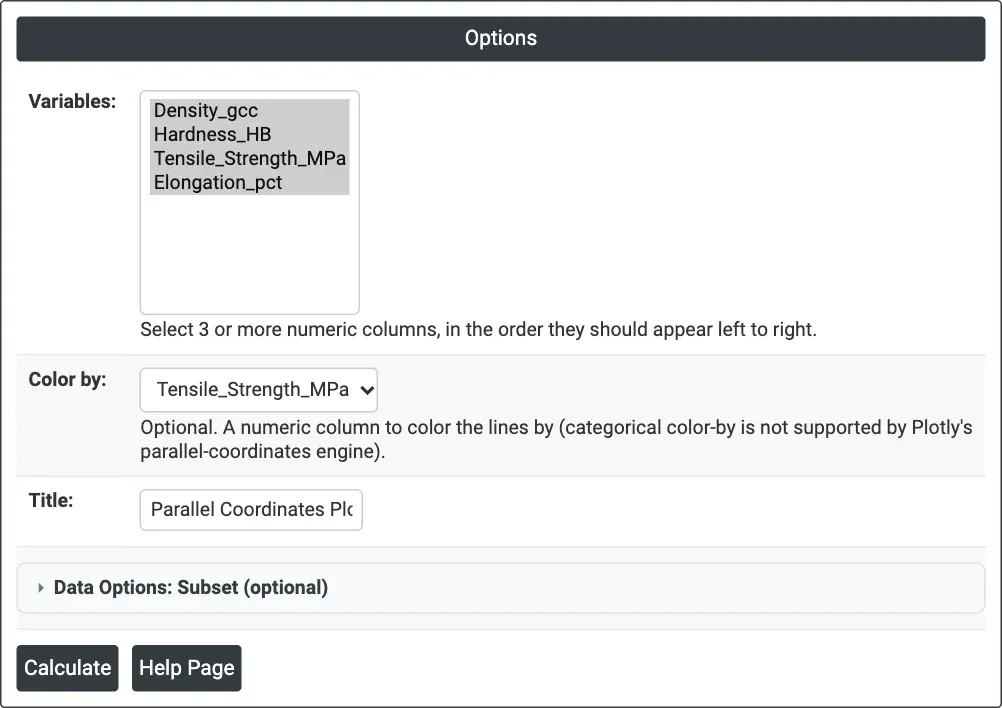
Figure 1 — Options for the example: four material properties, lines coloured by Tensile_Strength_MPa.
Output Descriptions
- Parallel Coordinates Plot — one axis per variable, labelled with its name and range, one line per row, and a colour bar when Color by is set.
- PDF export via Download.
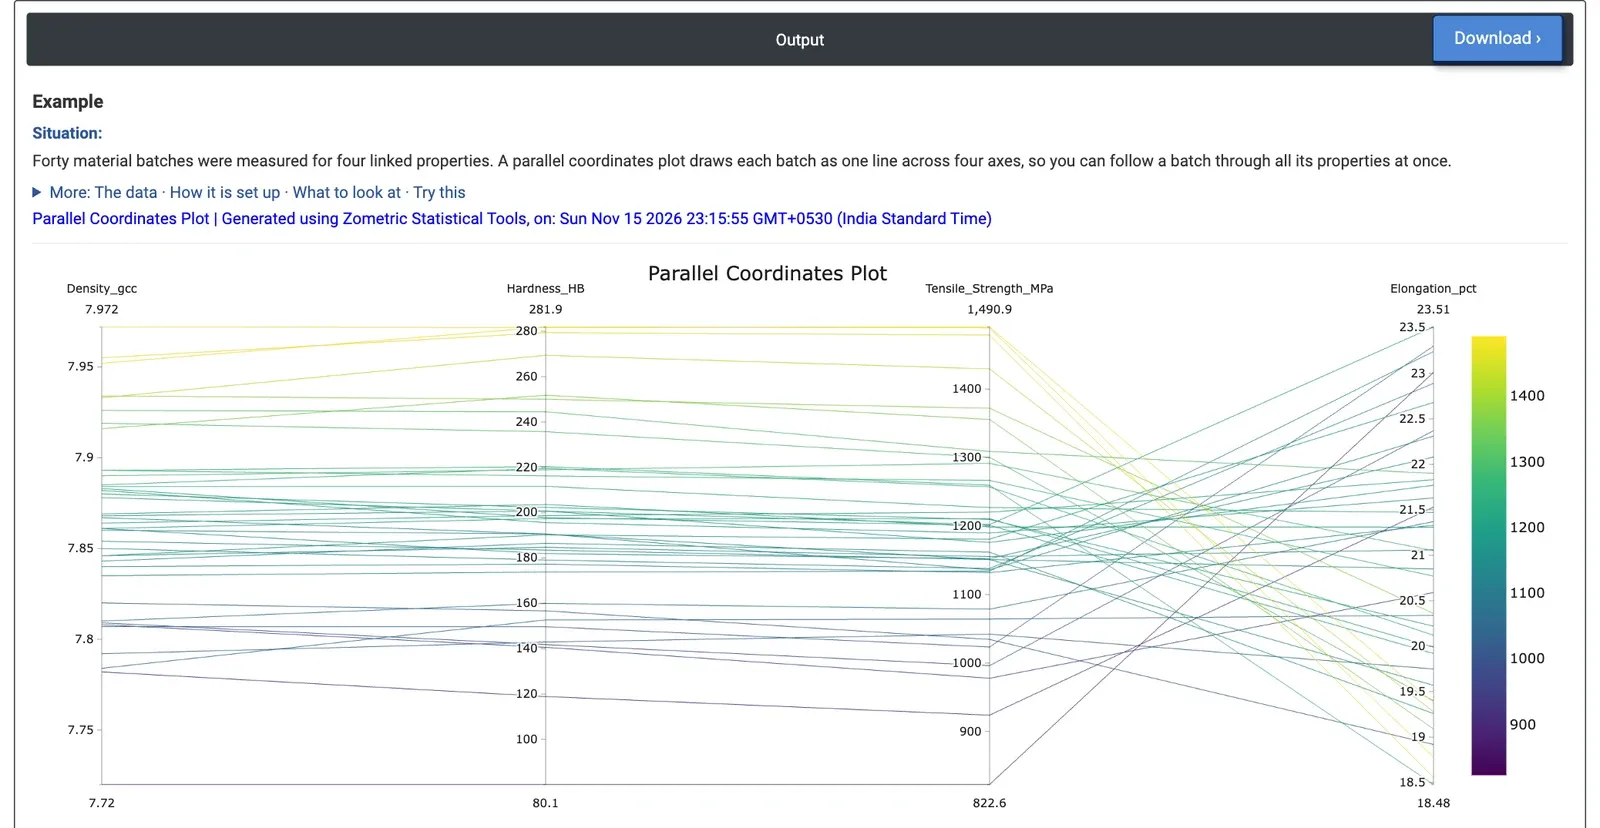
Figure 2 — Forty material batches across density, hardness, tensile strength and elongation; yellow lines are the strongest batches, purple the weakest.
Worked Example
A materials team has measured 40 batches for density (g/cc), hardness (HB), tensile strength (MPa) and elongation (%). They want to follow each batch through all four properties and see what the strongest and weakest batches have in common. Variables = Density_gcc, Hardness_HB, Tensile_Strength_MPa, Elongation_pct, in that order, and Color by = Tensile_Strength_MPa.
Between density, hardness and tensile strength the lines run almost parallel: the three properties rise together, and the yellow (strong) lines stay at the top of all three axes. Between tensile strength and elongation the lines cross: strong batches stretch less. The five strongest batches (1372.1 to 1490.9 MPa) all have elongation between 18.56% and 20.36%; the five weakest (822.6 to 1023.4 MPa) have 20.59% to 23.30%. The weakest batch, at 822.6 MPa, also has the lowest density (7.720 g/cc) and hardness (80.1 HB), so its line runs along the bottom of the first three axes.
The five strongest batches are all Premium and the five weakest all Standard. For the team this means a hardness check is a good proxy for strength, and that a requirement on both high strength and high elongation will be hard to meet with the current material: the plot shows no batch at the top of both axes.