
Power and Sample Size for 2 Proportions
On this page
Purpose
Power and Sample Size for 2 Proportions plans a comparison of two proportions before you collect the data, for example the defective rates of two lines, two suppliers or a process before and after a change. Enter any two of sample size, Proportion 2 and power, and the tool solves for the third: how many items each group needs, what chance a planned sample gives of detecting the difference, or how far Proportion 2 must be from Proportion 1 to be detected. Use it before a 2 Proportions test.
Key Capabilities
- Solves for sample size, power or Proportion 2: leave blank the one you want.
- Several values at once, e.g. Proportion 2 values “0.05 0.07” and power values “0.8 0.9”, give one row for each combination.
- Two-sided (Proportion 1 ≠ Proportion 2) or one-sided (Proportion 1 < Proportion 2, Proportion 1 > Proportion 2) alternatives, at the confidence level you choose.
- Equal sample size in both groups; when solving for sample size, reports the whole number per group and the actual power.
- Power curve of power against sample size for each Proportion 2, with the solved points marked.
Statistical Methods
The tool uses the normal approximation for the difference of two independent proportions, with the same sample size n in each group. The significance level is α = 1 − confidence level / 100, and z is z₁₋α/₂ for the two-sided alternative or z₁₋α for a one-sided one.
With p̄ = (p₁ + p₂)/2, the standard deviation under the null hypothesis is σ₀ = √(2·p̄(1 − p̄)) (pooled) and under the alternative σ₁ = √(p₁(1 − p₁) + p₂(1 − p₂)). Let Δ = p₁ − p₂ for Proportion 1 > Proportion 2, Δ = p₂ − p₁ for Proportion 1 < Proportion 2, and Δ = |p₁ − p₂| for the two-sided alternative. Power at n per group is Φ((Δ·√n − z·σ₀) / σ₁). The sample size for a target power is n = ((z·σ₀ + z_β·σ₁) / Δ)², with z_β the normal quantile of the power; n is rounded up and the power at that whole number is reported as the actual power. When solving for Proportion 2, the tool searches above Proportion 1 for Proportion 1 < Proportion 2 and for the two-sided alternative, and below it for Proportion 1 > Proportion 2.
A one-sided test only has power when Proportion 2 lies on the side the alternative names: with Proportion 1 > Proportion 2, a Proportion 2 above Proportion 1 gives a power near 0, and solving for sample size from it returns an error message. Small gaps between low proportions need very large samples. Proportions near 0 or 1 make the normal approximation less accurate, so treat answers for very small defect rates as a guide.
Input Fields & Options
Field | Description |
Sample sizes | Per group. Space or comma-separated, e.g. “50 100 150”. Leave blank to solve for sample size. |
Proportion 1 | Required. The proportion in the first group, e.g. the current or baseline rate, between 0 and 1. |
Proportion 2 value(s) | Space or comma-separated, e.g. “0.5 0.6”. The value(s) of Proportion 2 you want to detect. Leave blank to solve for it. |
Power values | Space or comma-separated, e.g. “0.8 0.9”. Leave blank to solve for power. |
Confidence level | Default 95 (α = 0.05); 75 to 100. |
Alternative hypothesis | Proportion 1 ≠ Proportion 2 (default), Proportion 1 < Proportion 2 or Proportion 1 > Proportion 2. |
Power curve | Ticked by default: draws power against sample size. |
Title | Title shown on the output and the power curve. |
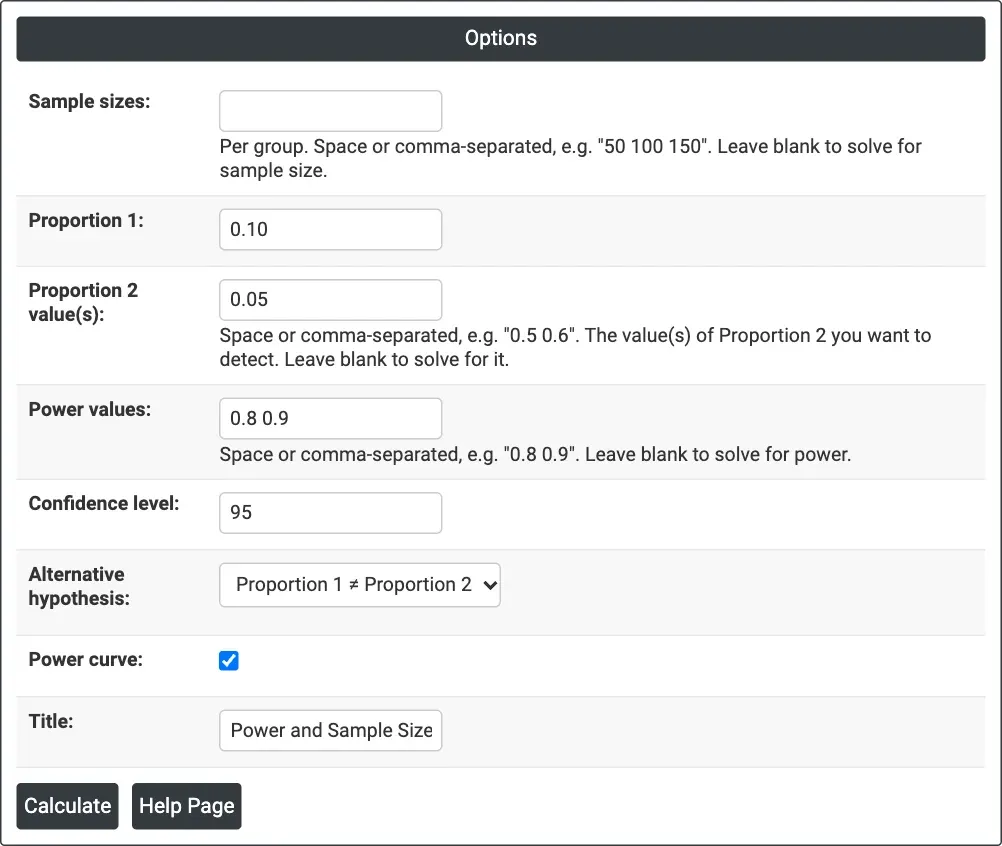
Figure 1 — Solving for sample size: Proportion 1 = 0.10, Proportion 2 value(s) = 0.05, Power values = 0.8 0.9, two-sided at 95% confidence.
Output Descriptions
- Settings — what was solved for, Proportion 1, the confidence level and the alternative hypothesis.
- Results — one row per combination: Proportion 2, sample size per group, and target and actual power when solving for sample size, or power when solving for power, or Proportion 2 when solving for it.
- Power Curve — power against sample size for each Proportion 2, with the calculated points marked.
- PDF export via Download.
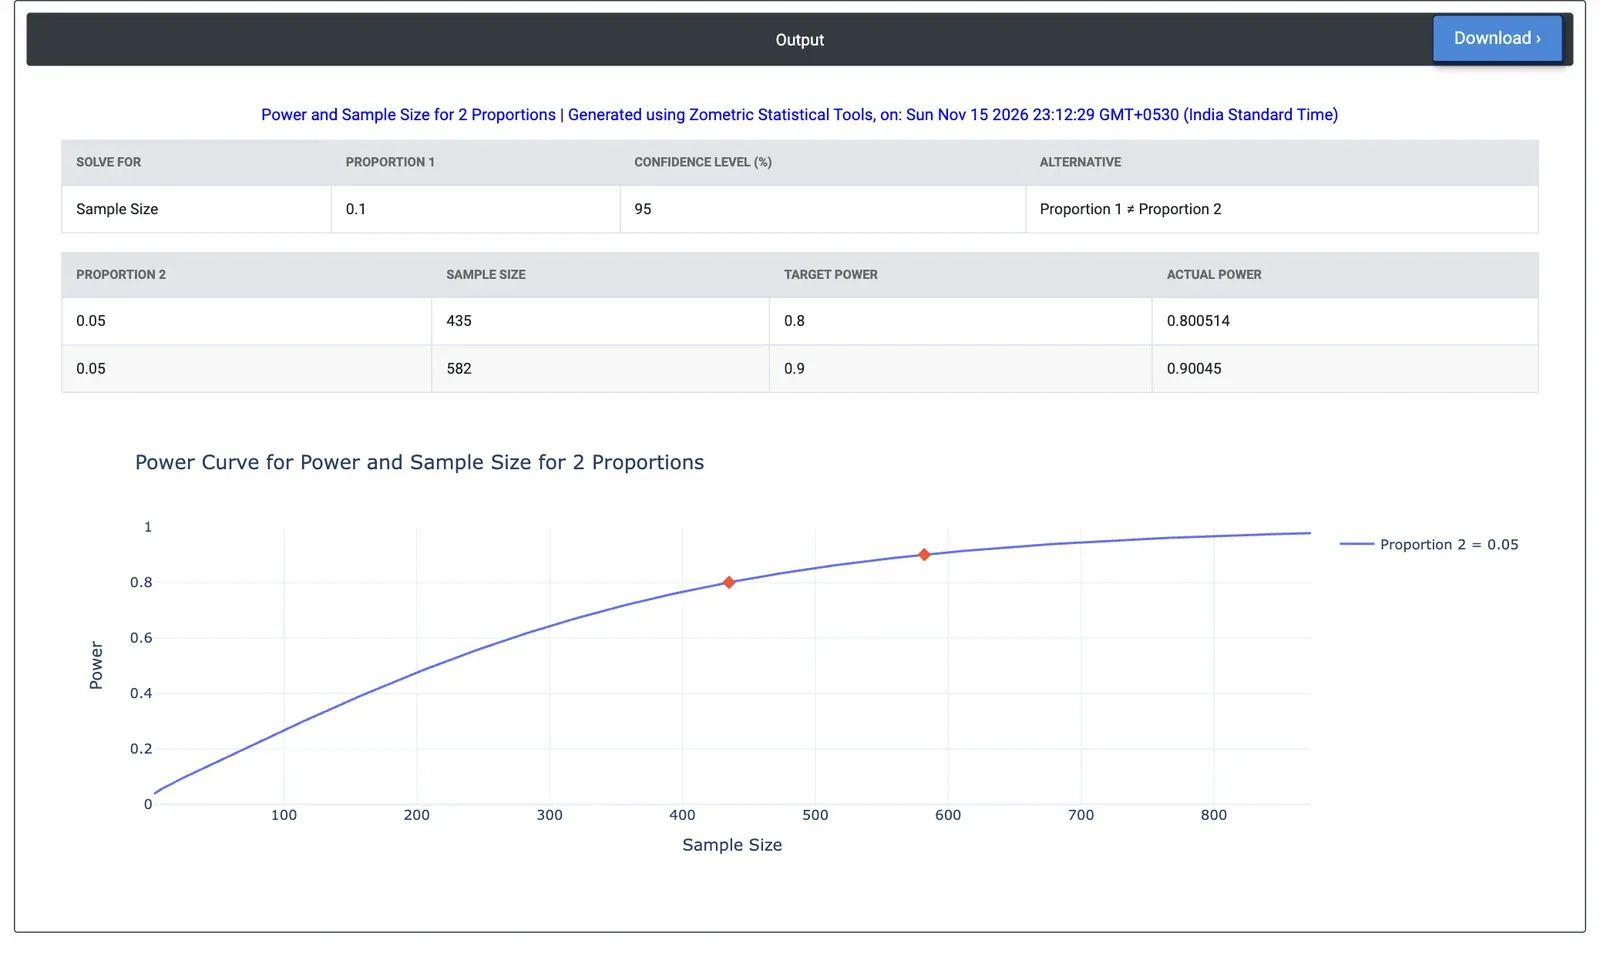
Figure 2 — Results for the example: 435 assemblies per line for 80% power and 582 for 90% power to tell a 10% defect rate from 5%.
Worked Example
An assembly plant runs an old line at about 10% rework and expects a new line with poka-yoke fixtures to run at 5%. Before the comparison trial, the engineer wants to know how many assemblies to inspect from each line. The engineer leaves Sample sizes blank and enters Proportion 1 = 0.10, Proportion 2 value(s) = 0.05 and Power values = 0.8 0.9, keeping the two-sided alternative at 95% confidence.
The tool needs 435 assemblies per line for 80% power (actual power 0.801) and 582 per line for 90% power (actual power 0.900). A trial of 200 per line would have a power of only 0.475. If the new line only improves to 7%, 1356 assemblies per line are needed for 80% power, so a small improvement is costly to prove. If the only question is whether the new line is better (Proportion 1 > Proportion 2), 343 per line give 80% power for the 10% versus 5% case.