
Power and Sample Size for 2 Variances
On this page
Purpose
Power and Sample Size for 2 Variances plans a comparison of the spread of two independent groups, for example the repeatability of two machines, two gauges or two suppliers. The difference in spread is entered as the ratio of the two standard deviations (σ₁/σ₂), so you do not need to enter the standard deviations themselves. Enter any two of sample size, ratio and power, and the tool solves for the third: how many units each group needs, what power a planned sample gives, or the smallest ratio a given sample can detect. Use it before a 2 Variances test.
Key Capabilities
- Solves for sample size, power or ratio: leave blank the one you want.
- Several values at once, e.g. ratios “1.5 2” and power values “0.8 0.9”, give one row for each combination.
- Two-sided or one-sided alternatives, at the confidence level you choose.
- Exact F-distribution calculation with equal sample sizes in both groups.
- Power curve of power against sample size for each ratio, with the solved points marked.
Statistical Methods
The test behind the calculation is the F-test for two variances: with n units in each group from normal populations, F = S₁²/S₂² follows an F distribution with (n − 1, n − 1) degrees of freedom when the standard deviations are equal. If the true ratio is r = σ₁/σ₂, F is r² times such a variable. The significance level is α = 1 − confidence level / 100.
For the “greater than” alternative (σ₁ > σ₂), power = P(F > f₁₋α / r²); for “less than”, power = P(F < f_α / r²); for the two-sided test both tails count, using f_α/2 and f₁₋α/2, the quantiles of F with (n − 1, n − 1) degrees of freedom. The sample size for a target power is found numerically and rounded up, and the power at that whole number is reported as the actual power. When solving for the ratio, the tool searches below 1 for the “less than” alternative and above 1 otherwise.
Because the groups are the same size, a ratio of r and a ratio of 1/r give the same two-sided result (1.5 and 0.667 both need 50 per group for 80% power). The F-test assumes normal data and is sensitive to departures from normality.
Input Fields & Options
Field | Description |
Sample sizes | Per group. Space or comma-separated, e.g. “10 20 30”. Leave blank to solve for sample size. |
Ratio(s) | Space or comma-separated, e.g. “1.5 2”. Ratio of the two true standard deviations (σ₁/σ₂) that you want to detect. Leave blank to solve for it. |
Power values | Space or comma-separated, e.g. “0.8 0.9”. Leave blank to solve for power. |
Confidence level | Default 95 (α = 0.05); 75 to 100. |
Alternative hypothesis | σ1/σ2 ≠ 1 (default), σ1/σ2 < 1 (σ₁ < σ₂) or σ1/σ2 > 1 (σ₁ > σ₂). |
Power curve | Ticked by default: draws power against sample size. |
Title | Title shown on the output and the power curve. |
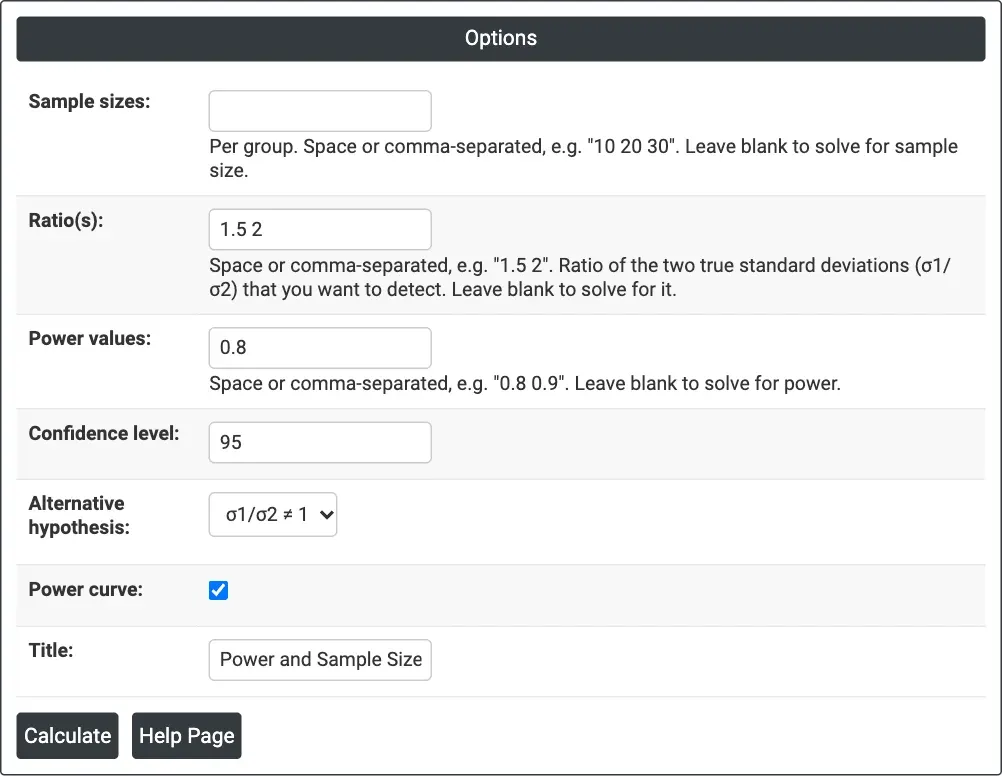
Figure 1 — Solving for sample size: Ratio(s) = 1.5 2, Power values = 0.8, two-sided at 95% confidence.
Output Descriptions
- Settings — what was solved for, the confidence level and the alternative hypothesis.
- Results — one row per combination: ratio, sample size per group, and target and actual power when solving for sample size, or power when solving for power, or ratio when solving for ratio.
- Power Curve — power against sample size for each ratio, with the calculated points marked.
- PDF export via Download.
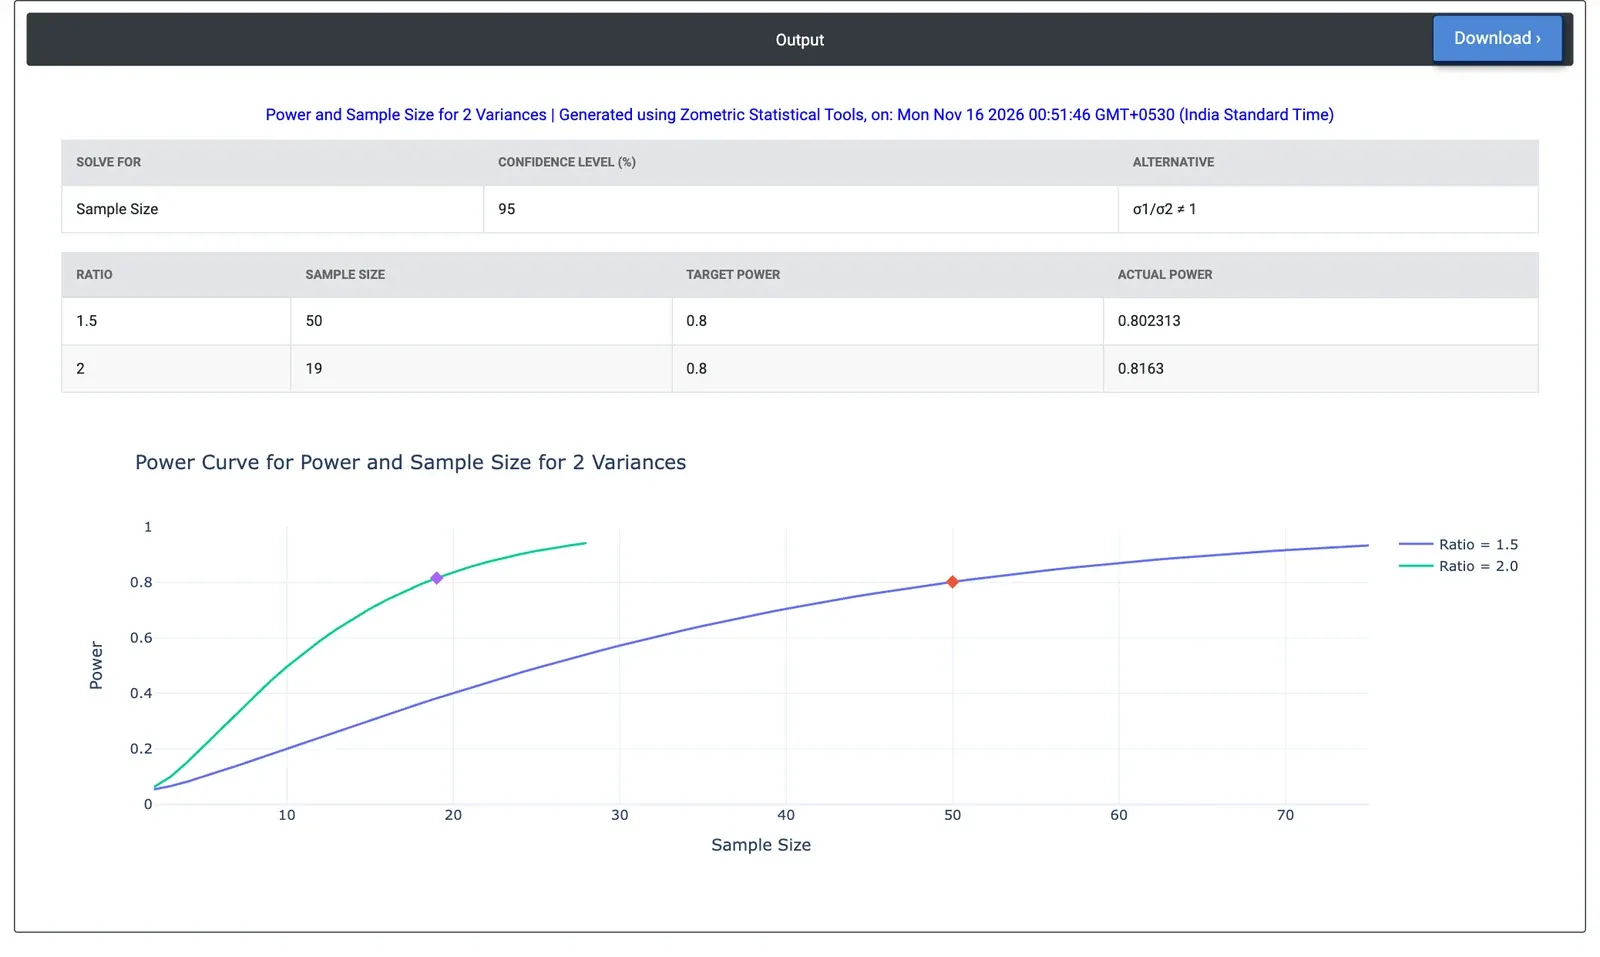
Figure 2 — Results for the example: 50 parts per machine to detect a ratio of 1.5 and 19 per machine for a ratio of 2, both at 80% power.
Worked Example
A machining shop wants to compare the bore-diameter variation of an old and a new CNC machine. A standard deviation ratio of 1.5 would justify moving the critical work to the better machine, and a ratio of 2 would be serious. The engineer leaves Sample sizes blank, enters Ratio(s) = 1.5 2 and Power values = 0.8, and keeps the two-sided alternative at 95% confidence.
The tool needs 50 parts from each machine to detect a ratio of 1.5 with 80% power (actual power 0.802), and 19 parts each for a ratio of 2 (actual power 0.816). For 90% power the figures rise to 66 and 24 parts per machine. A trial of 20 parts per machine has a power of only 0.402 for a ratio of 1.5, so a non-significant result from such a trial says little. If the question is only whether the old machine is worse (alternative σ1/σ2 > 1), 40 parts per machine give 80% power at a ratio of 1.5.