
Process Sigma Calculator
On this page
Purpose
The Process Sigma Calculator turns defect counts, defective counts, a DPMO or ppm figure, or a yield into the standard Six Sigma metrics: DPU, DPO, DPMO, yield, and the long-term and short-term sigma level. For a process of several steps it also gives the rolled throughput yield (RTY), the chance a unit passes every step first time, which shows the hidden factory that final yield hides. Use it to state the baseline of a project, compare processes on one scale, or show the gain after an improvement.
Key Capabilities
- Five ways in: Defects and opportunities, Defective units, DPMO or PPM, Yield (%), or Process steps (rolled throughput yield).
- Process steps from worksheet columns (step names, units, defects, optional opportunities per unit) or typed in as one yield per step.
- Step yield from defects (e^−DPU) or from defective units (1 − defectives/units).
- RTY, total DPU, normalized yield and the sigma level of both.
- Sigma shift you can set: 1.5 by convention, 0 for no shift.
- Sigma Level and DPMO curve with this process marked, and a bar chart of the throughput yield by step.
- PDF export via Download.
Statistical Methods
Defects and opportunities: DPU = defects / units, DPO = defects / (units × opportunities per unit), DPMO = DPO × 10⁶ and yield = 1 − DPO; the Poisson first-pass yield e^−DPU is also shown. Defective units: proportion defective p = defectives / units, ppm = p × 10⁶ and yield = 1 − p. DPMO or PPM: yield = 1 − DPMO / 10⁶. The long-term Z is the standard normal quantile of the yield, Z.LT = Φ⁻¹(yield), and the short-term sigma level adds the shift: Z.ST = Z.LT + shift. With the conventional 1.5 shift, 3.4 DPMO gives a sigma level of 6.0. At a yield of 0% or 100% Z is infinite and is shown as *.
Process steps: each step's throughput yield is e^−DPU (counts are defects) or 1 − defectives/units (counts are defective units), or the typed yield. RTY is the product of the step yields, total DPU = −ln(RTY), and the normalized yield RTY^(1/k) for k steps is the average yield per step. Sigma levels are given for both RTY and the normalized yield. The opportunities column only affects the DPMO column of the step table, not the yields. The 1.5 shift is a convention for long-term drift, not a measured value; report which shift you used, and use 0 to quote the long-term Z alone.
Input Fields & Options
Field | Description |
Calculate from | Defects and opportunities (default), Defective units, DPMO or PPM, Yield (%), or Process steps (rolled throughput yield). The fields below change with the choice. |
Units inspected / Opportunities per unit / Defects found | Defects and opportunities: units inspected, the number of ways one unit can be defective (default 1) and the defects found. |
Defective units | Defective units: the number of units with at least one defect, with Units inspected. |
DPMO or PPM | DPMO or PPM: 0 to 1,000,000. |
Yield (%) | Yield (%): 0 to 100. |
Process steps | Process steps: Steps are in worksheet columns (default) or Type the yield of each step. |
Step names (optional) / Units column / Defects column | Worksheet columns with each step's name, units and count. Units and Defects are required. |
Opportunities per unit column (optional) | Used for the DPMO column only; blank = 1. |
The counts are | Defects: step yield = e^−DPU (default), or Defective units: step yield = 1 − defectives/units. |
Step yields (%) | Type the yield of each step: one value per step in process order, e.g. 98.5 97 99.2. |
Sigma shift | Added to the long-term Z to give the short-term sigma level. Default 1.5; 0 to 3. |
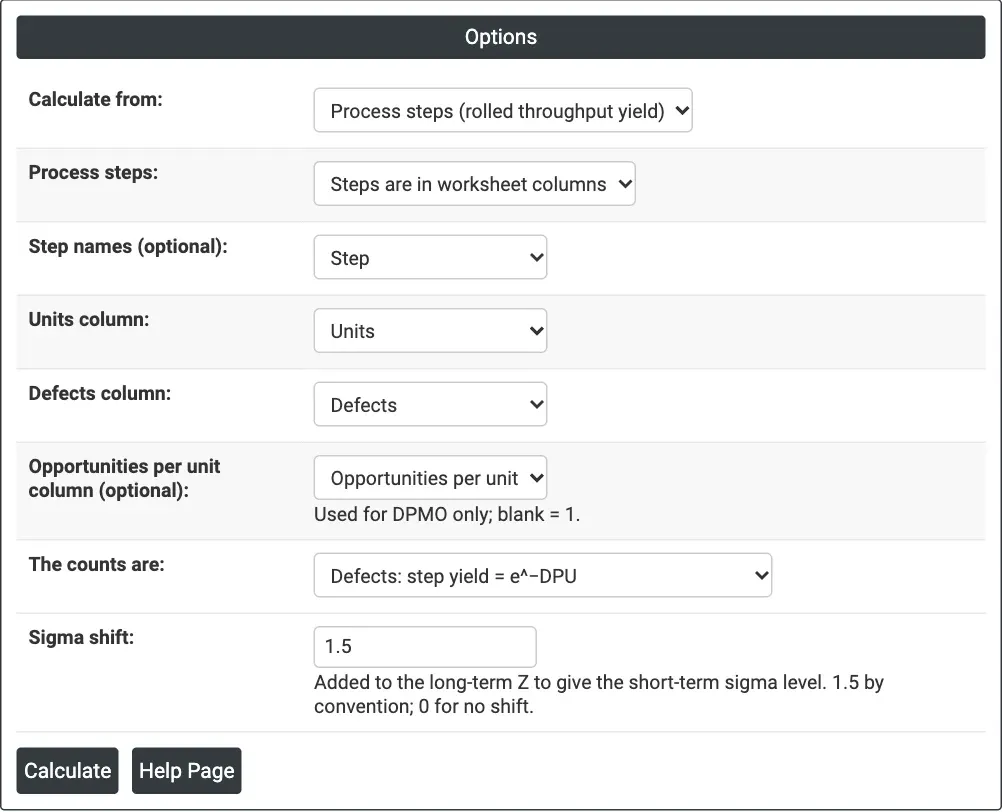
Figure 1 — Options for the example: process steps from the worksheet columns Step, Units, Defects and Opportunities per unit, counts as defects, sigma shift 1.5.
Output Descriptions
- Process Sigma — the metrics for the chosen input: units, opportunities, defects, DPU, DPO, DPMO, yield, Z.LT and the short-term sigma level; for process steps, the number of steps, RTY, total DPU, normalized yield and their sigma levels.
- Sigma Level and DPMO — DPMO (log scale) against the short-term sigma level for the chosen shift, with this process marked.
- Process Steps — per step: units, defects (or defective units), DPU (or % defective), DPMO and throughput yield (process steps only).
- Throughput Yield by Step — bar chart of each step's yield with the RTY as a dashed line (process steps only).
- PDF export via Download.
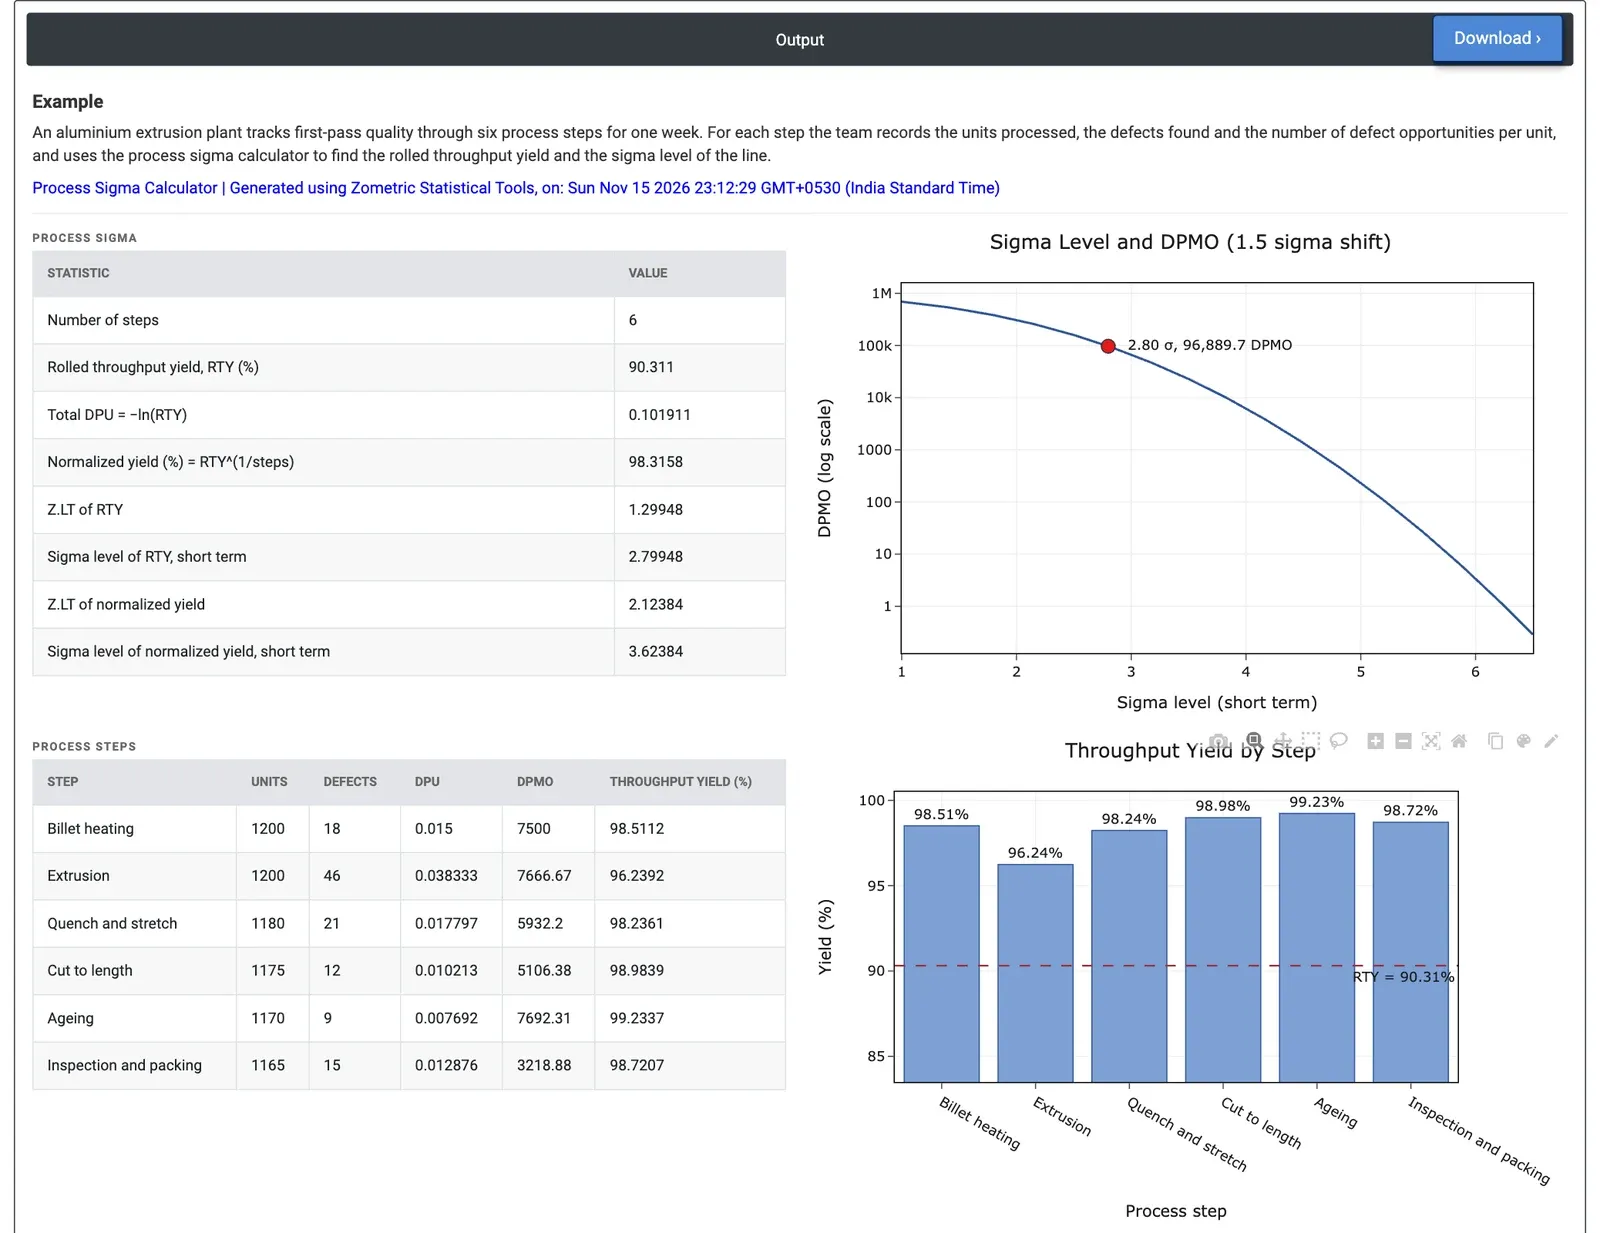
Figure 2 — Six extrusion steps: every step yields over 96%, but the rolled throughput yield is 90.31%, a short-term sigma level of 2.80.
Worked Example
An aluminium extrusion plant tracks first-pass quality through six steps for one week, from billet heating to inspection and packing. For each step the worksheet holds the units processed (1,165 to 1,200), the defects found and the defect opportunities per unit. Calculate from = Process steps, with the step columns chosen and the counts treated as defects.
Each step looks good on its own: throughput yields run from 96.24% (extrusion, 46 defects in 1,200 units, DPU 0.0383) to 99.23% (ageing). Multiplied together they give an RTY of 90.31%: almost one profile in ten needs rework or is scrapped somewhere along the line. Total DPU is 0.102, the long-term Z of the RTY is 1.30 and its short-term sigma level is 2.80 (96,890 DPMO on the curve); the normalized yield of 98.32% per step corresponds to 3.62 sigma. Extrusion is the weakest step and the obvious target: halving its defects to 23 would raise the RTY to 92.06% and the sigma level of the RTY to 2.91.