
Sample Size for Estimation
On this page
Purpose
Sample Size for Estimation works out how many observations are needed to estimate a mean or a proportion to a chosen precision, or how precise the estimate will be with a given sample. Precision is expressed as the margin of error: the half-width of the confidence interval, so that the estimate is “value ± margin”. Use it when the aim is to measure something well, such as the average cycle time, the mean coating weight or the share of late orders, rather than to test a difference (for that, use the power and sample size tools for hypothesis tests).
Key Capabilities
- Estimates a Mean (with an assumed standard deviation) or a Proportion (with a planning value).
- Solves for sample size from target margins of error, or for the margin of error from planned sample sizes: leave blank the one you want.
- Several values at once, e.g. margins “0.5 1”, give one row each.
- When solving for sample size, reports the whole number of observations and the margin of error it actually achieves.
- Any confidence level from 75 to 100%.
Statistical Methods
For a mean, the standard deviation entered is a planning value rather than a known one, so the margin of error uses the t distribution, as does the confidence interval you will later compute from the data (Minitab works the same way when σ is not known). For a proportion the tool uses the normal approximation. With confidence level C, α = 1 − C/100; z = z₁₋α/₂ (1.960 for 95%) and t = t₁₋α/₂ with n − 1 degrees of freedom.
For a mean with assumed standard deviation σ, the margin of error with n observations is E = t·σ/√n. Because t depends on n, the sample size for a target margin E is the smallest n whose margin is at most E: the tool starts from the normal answer (z·σ/E)², rounded up, and steps up one at a time. For a proportion with planning value p, the margin is E = z·√(p(1 − p)/n), so n = z²·p(1 − p)/E², rounded up to the next whole number. In both cases the margin at the reported n is shown as the actual margin of error, which is at most the target.
The margin falls with the square root of n: halving the margin needs about four times as many observations. For a mean, the margin assumes the sample standard deviation comes out close to the planning value; if the data are more variable, the interval will be wider. For a proportion, a planning value of 0.5 gives the largest (safest) sample size; use a smaller value only if you are confident the proportion is far from 0.5. The result assumes a random sample from a stable process.
Input Fields & Options
Field | Description |
Parameter to estimate | Mean (default) or Proportion. |
Sample sizes | Space or comma-separated, e.g. “10 20 30”. Leave blank to solve for sample size. |
Margins of error | Space or comma-separated, e.g. “1 2”. The half-width of the confidence interval, in measurement units for a mean or as a fraction (e.g. 0.03) for a proportion. Leave blank to solve for margin of error. |
Assumed standard deviation | Required when Parameter = Mean. Historical or pilot estimate of the standard deviation, used as a planning value (the margin uses the t distribution). |
Planning value for the proportion | Required when Parameter = Proportion; default 0.5, between 0.0001 and 0.9999. 0.5 is the most conservative (largest sample size) choice. |
Confidence level | Default 95; 75 to 100. |
Title | Title shown on the output. |
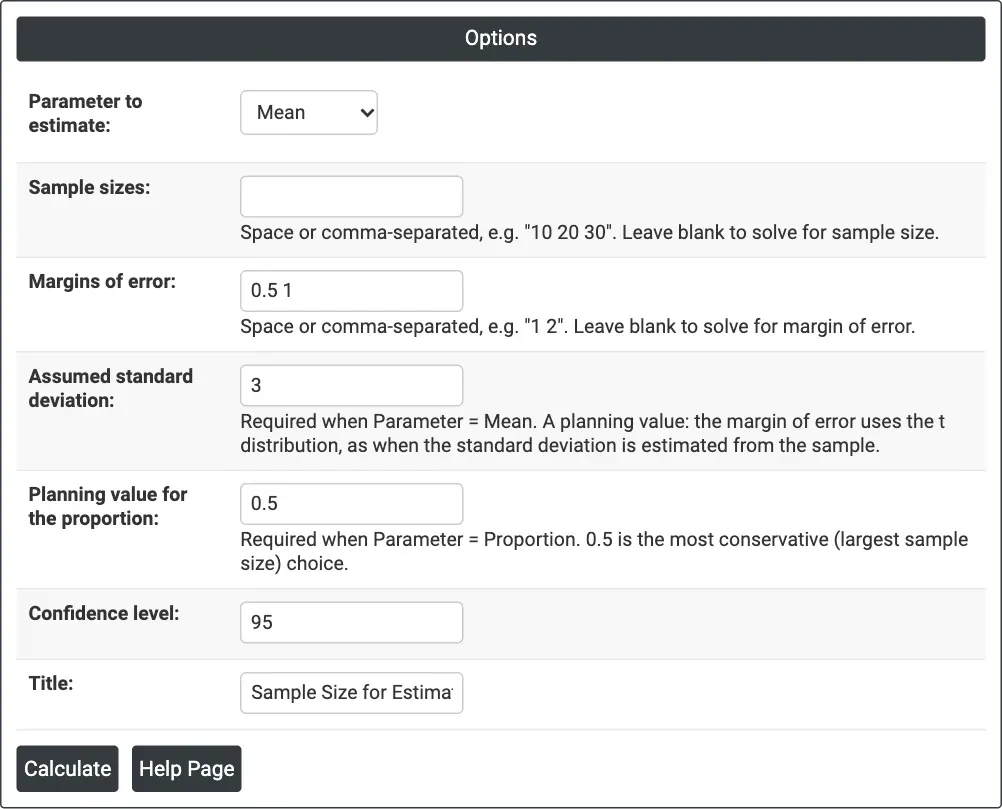
Figure 1 — Solving for sample size for a mean: Margins of error = 0.5 1, Assumed standard deviation = 3, at 95% confidence.
Output Descriptions
- Settings — what was solved for, the parameter, the confidence level and the assumed standard deviation (for a mean) or the planning value (for a proportion).
- Results — one row per value: margin of error, sample size and actual margin of error when solving for sample size, or sample size and margin of error when solving for margin of error.
- PDF export via Download.
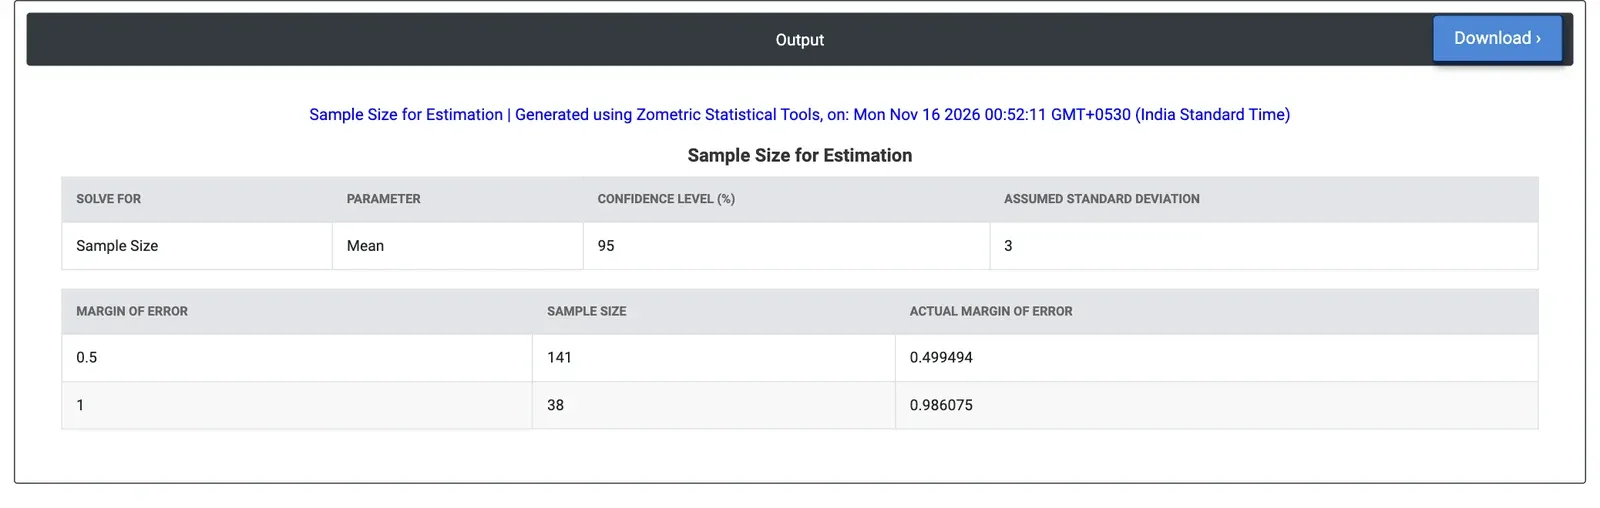
Figure 2 — Results for the example: 141 cycles for a ±0.5 s margin and 38 cycles for a ±1 s margin at 95% confidence.
Worked Example
An industrial engineer needs the average cycle time of a manual assembly station for a line-balancing study. A short pilot shows a standard deviation of about 3 seconds. The engineer would like the mean to within ±0.5 s, but could accept ±1 s. With Parameter to estimate = Mean, the engineer leaves Sample sizes blank, enters Margins of error = 0.5 1 and Assumed standard deviation = 3, at 95% confidence.
The tool needs 141 timed cycles for a ±0.5 s margin (actual margin 0.499 s) and 38 cycles for ±1 s (actual margin 0.986 s): halving the margin multiplies the work by about four. Entering Sample sizes = 20 50 instead shows that 20 cycles give a margin of ±1.40 s and 50 give ±0.85 s. At 99% confidence the requirements rise to 243 and 64 cycles. For a proportion, for example the share of cycles with a rework step, a margin of ±0.03 needs 1068 observations with the conservative planning value 0.5, but 385 if the share is known to be around 0.1.