
Solution Desirability Matrix
On this page
Purpose
The Solution Desirability Matrix helps a team choose between competing solutions in the Improve phase. The team agrees the selection criteria (for example defect reduction, cost, ease and speed of implementation), weights each one by how much it matters, and rates every proposed solution against every criterion. The tool turns the ratings into a weighted score per solution, ranks them in a Pareto chart, and records which solution was selected, so the choice is open and can be explained to the sponsor.
Key Capabilities
- Any number of proposed solutions (rows) and selection criteria (columns), entered in the worksheet.
- Weighted Score and % of Total for each solution, with a weighting row and a total row in the matrix.
- Optional Label column (A, B, C ...) used as the short name on the Pareto chart.
- Pareto Chart of Proposed Solutions, highest score first, with the cumulative percent.
- Check the Ratings: flags ratings outside the 1 to 9 scale.
- The selected solution recorded with the matrix, and PDF export via Download.
Statistical Methods
Each criterion j has a weight wⱼ (1 to 9) and each solution i a rating rᵢⱼ (1 = weak to 9 = strong agreement that the solution meets the criterion). Weighted Score = Σⱼ wⱼ·rᵢⱼ and % of Total = weighted score / sum of all weighted scores × 100. A blank rating counts as 0. Rate every criterion so that a high rating is good: for cost or time, a cheap or quick solution gets a high rating, not a high cost.
The worksheet needs a column named Proposed Solution (or Solution), one solution per row, and one numeric column per criterion, named after it; an optional Label column gives each solution a short label. A row whose Proposed Solution cell starts with Weight, Weights or Weighting holds the weights. Every other column with numbers is treated as a criterion. The matrix is a structured team judgement, not a measurement: solutions close in score deserve a closer look (a pilot, a cost estimate or a risk review) rather than a choice on the score alone, and it is worth checking whether the ranking holds when the weights change.
Input Fields & Options
Field | Description |
Project Name / Prepared By / Prepared Date | Header of the report. |
What solution was selected? | Free text: the team's decision. Its help text describes the worksheet layout. |
Worksheet | Columns Proposed Solution (optional Label), one column per selection criterion with ratings 1 to 9, and a Weighting row with each criterion's weight (1 to 9). Load Example fills in a complete matrix. |
Calculate | Computes the weighted scores and draws the Pareto chart. |
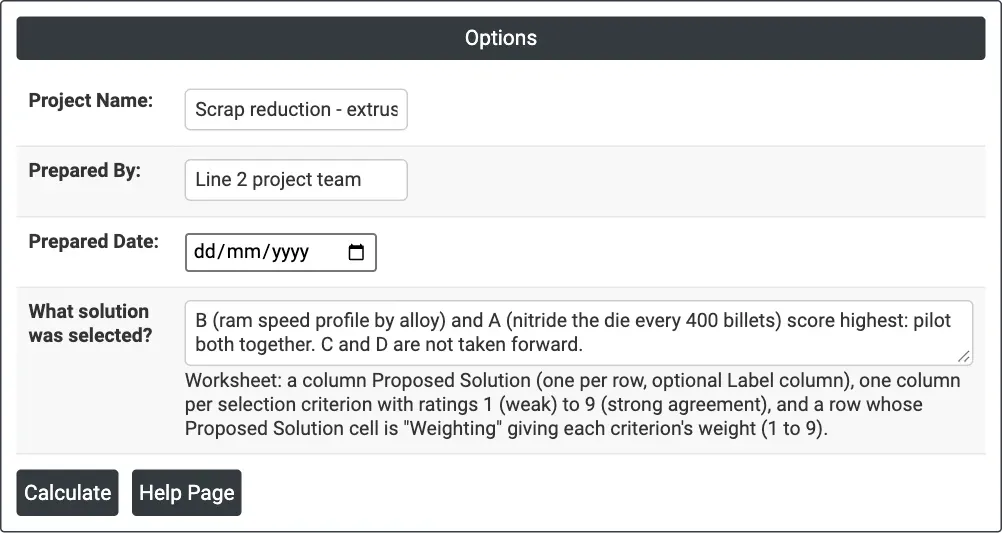
Figure 1 — Options for the example: project header and the team's selection.
Output Descriptions
- Solution Desirability Matrix — Project Name, Prepared By and Prepared Date.
- Solution Desirability Matrix (table) — the Solution Selection Criteria Weighting row, one row per solution with its ratings, Weighted Score and % of Total, and a Total row.
- Pareto Chart of Proposed Solutions — weighted score per solution, highest first, with the cumulative percent on the right axis.
- Conclusion — What solution was selected?
- Check the Ratings — shown only when a rating is outside 1 to 9.
- PDF export via Download.
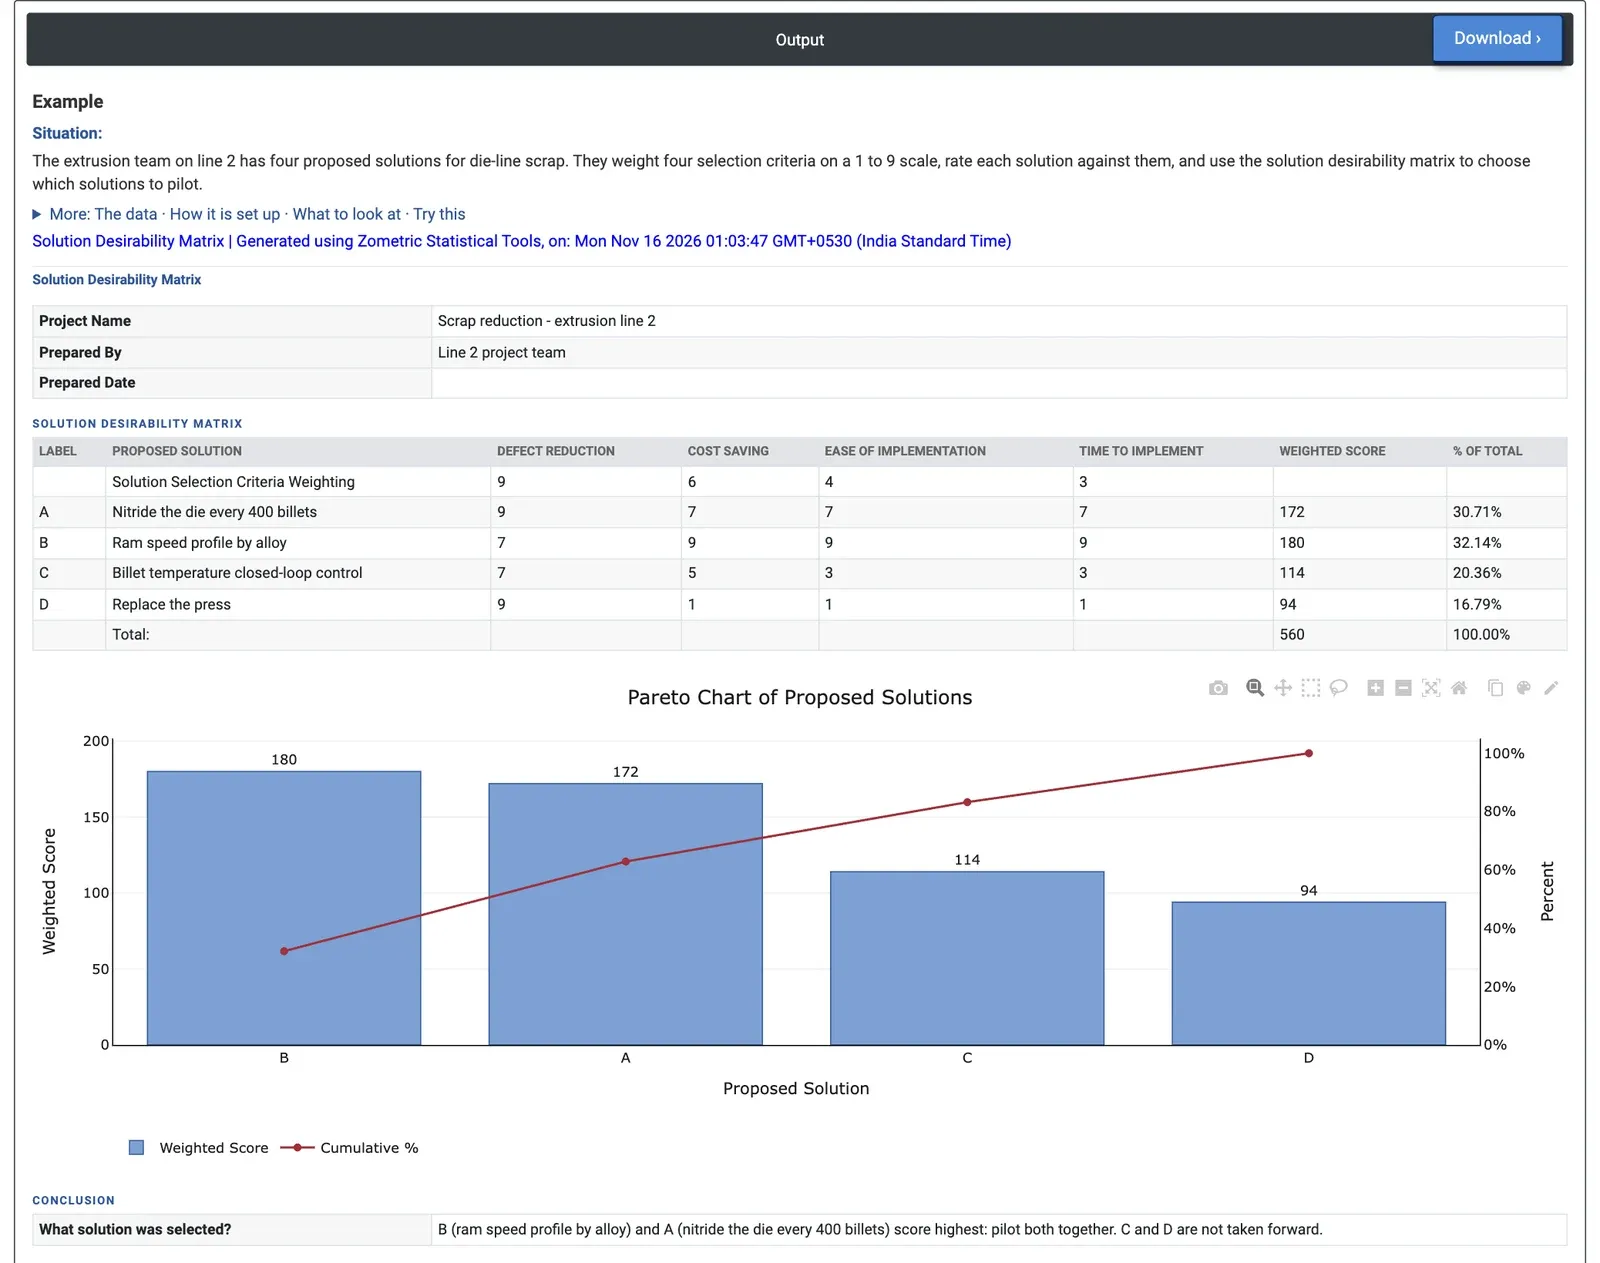
Figure 2 — Four solutions for die-line scrap: B (ram speed profile by alloy) scores 180 and A (nitride the die every 400 billets) 172, well ahead of C and D.
Worked Example
The extrusion team on line 2 has four proposed solutions for die-line scrap: A, nitride the die every 400 billets; B, a ram speed profile by alloy; C, closed-loop control of billet temperature; and D, replace the press. They weight four criteria: defect reduction 9, cost saving 6, ease of implementation 4 and time to implement 3, and rate each solution from 1 to 9 on each.
B scores highest at 180 (7×9 + 9×6 + 9×4 + 9×3), 32.14% of the total of 560, and A follows closely at 172 (30.71%): together 63% of the total. C scores 114 (20.36%) and D 94 (16.79%). D would remove as many defects as A (rating 9) but scores 1 on cost, ease and time, which sinks it. All ratings are on the 1 to 9 scale, so no Check the Ratings table appears. Since A and B are close and attack different causes, the team decides to pilot both together and not to take C and D forward. The ranking is not sensitive to the heavy weight on defect reduction: with that weight cut from 9 to 3, B (138) and A (118) still lead and D falls to 40.