
Stem-and-Leaf Plot
On this page
Purpose
The Stem-and-Leaf Plot is a text display that shows the shape of a set of measurements while keeping every value. Each value is split into a stem (its leading digits) and a leaf (the next digit); the leaves on one line form a sideways bar, so the display reads like a histogram in which you can still see the numbers. Use it for small to medium samples, to see the centre, spread, skewness, gaps and extreme values, and to compare a few groups such as shifts or machines.
Key Capabilities
- Leaf unit chosen automatically, or set by you so that several displays use the same scale.
- Depth column: cumulative counts from each end, with the line holding the median marked by its own count in brackets.
- Extreme values beyond 3 IQR from the quartiles listed separately as LO and HI rows, so they do not stretch the display.
- One display per group of a By column, up to 6 groups.
Statistical Methods
The values are sorted and divided by the leaf unit u. For a value x, the stem is ⌊x / (10u)⌋ and the leaf is the next digit, ⌊x/u⌋ − 10 × stem: with u = 1, 42.6 has stem 4 and leaf 2 and is read as 42. Leaves are truncated, not rounded. Every stem between the lowest and highest is listed, even if it has no leaves, so gaps in the data show as empty lines.
When Increment is left empty, the leaf unit is the power of 10 just below (range / m), where m is the sample size capped at 20 lines; for example a range of 11.1 over 15 values gives a leaf unit of 0.1. With a By column the leaf unit is worked out once, from all the grouped values together, so every group's display uses the same scale and can be compared line by line; an Increment you enter is also used for every group.
The depth column counts values from the nearer end: on lines below the median it is the number of values on that line and all lower lines; above the median, on that line and all higher lines. The median line shows its own count in brackets. With Trim extreme outliers ticked and at least 10 values, values below Q1 − 3×IQR or above Q3 + 3×IQR are taken out of the body and counted in a LO or HI row.
Input Fields & Options
Field | Description |
Data column | Required. Numeric column to display. |
By (grouping) column | Optional. One display per group, as in Minitab, all with the same leaf unit (up to 6 groups; groups with fewer than 2 values are skipped). |
Increment (leaf unit) | Optional. The value of one leaf digit, e.g. 1, 0.1 or 10. Leave empty to calculate it automatically (from all the data when a By column is set). |
Trim extreme outliers into LO/HI rows | Ticked by default. Values more than 3×IQR beyond the quartiles are listed as LO/HI counts instead of on the stems (samples of 10 or more). |
Data Options: Subset (optional) | Exclude matching rows (default) or Include only matching rows; Row numbers (e.g. 3,7,12-15) and/or a Condition (e.g. Shift == "Night") select the rows. |
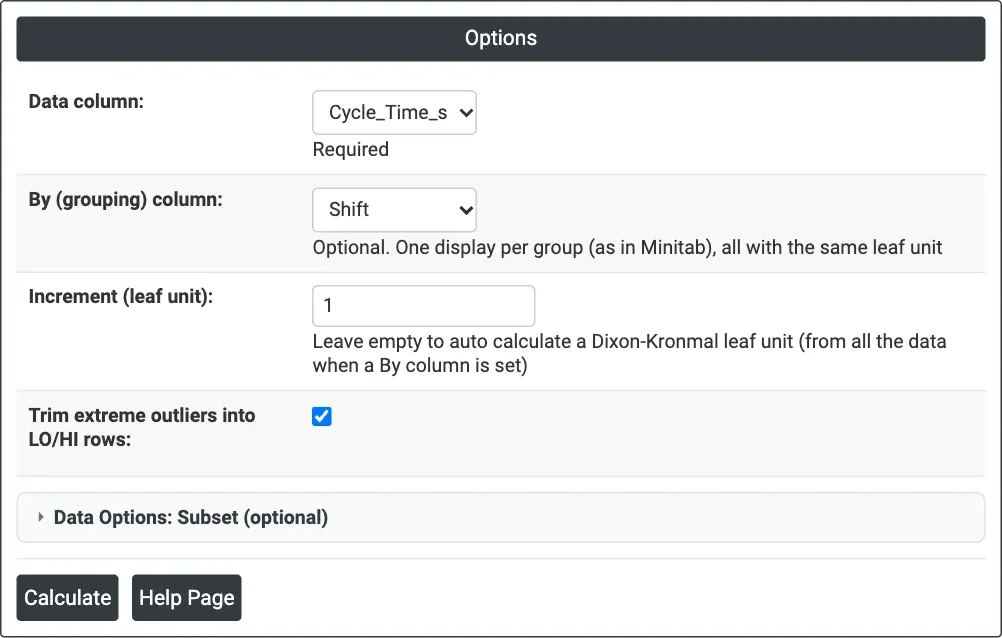
Figure 1 — Options for the example: Cycle_Time_s by Shift with a leaf unit of 1 second.
Output Descriptions
- Stem-and-Leaf Display: <column> (<By column> = <group>) — the header line with N and Leaf Unit, then one line per stem: depth, stem, and the leaves in order; LO and HI rows when extreme values are trimmed.
- PDF export via Download.
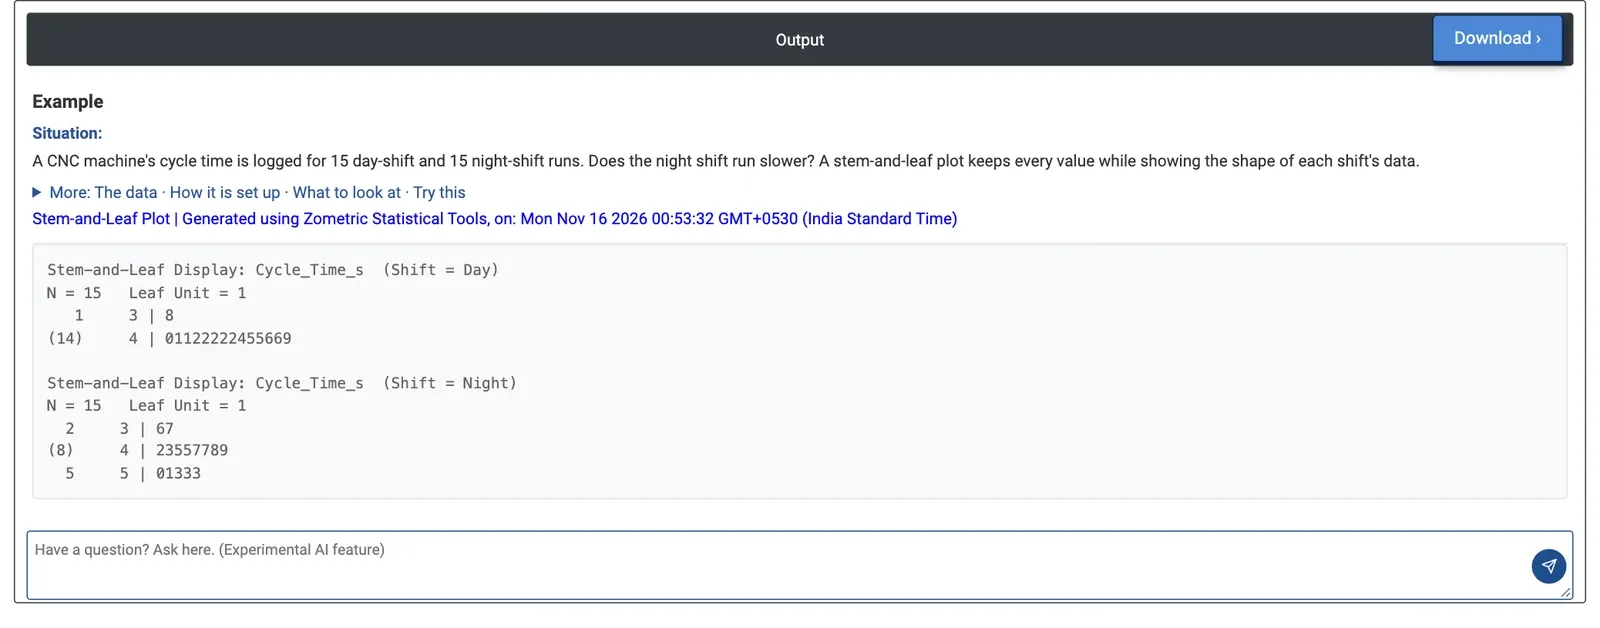
Figure 2 — Stem-and-leaf displays of CNC cycle time for 15 day-shift and 15 night-shift runs, leaf unit 1 second.
Worked Example
A CNC machine's cycle time is logged for 15 day-shift and 15 night-shift runs, and the production engineer wants to know whether the night shift runs slower. Data column = Cycle_Time_s, By (grouping) column = Shift and Increment = 1, so both displays use whole seconds: stem 4 with leaf 2 means 42 seconds.
Day: one run in the 30s (38) and the other 14 in the 40s, packed between 40 and 46 apart from one at 49. Night: two runs in the 30s (36, 37), eight in the 40s and five in the 50s (50 to 53). The night shift is both slower and less consistent: mean 47.1 against 43.5 seconds, medians 47.7 against 42.7, and range 36.6 to 53.8 against 38.8 to 49.9 seconds. No values were trimmed as extreme.
The engineer would look at what changes between shifts (set-up, tool changes, operator practice) and could confirm the difference with a two-sample t-test or a test for equal variances. Leaving Increment empty gives both displays a leaf unit of 0.1, one line per whole second (38 to 49 for the day shift, 36 to 53 for the night shift), which is finer than needed for 15 values per shift. Clearing the By column instead gives one display of all 30 runs (3 in the 30s, 22 in the 40s, 5 in the 50s), which hides the difference between the shifts.