
T² – Generalized Variance Chart
On this page
Purpose
The T² – Generalized Variance Chart monitors two or more related characteristics measured together on each part, in subgroups, on one page. The Hotelling T² chart asks whether the subgroup's mean vector has moved away from the process centre, taking the correlation between the variables into account. The generalized variance chart asks whether the joint spread of the variables has grown. Use it instead of separate Xbar and R charts for each characteristic when the characteristics move together, such as the diameter and length of a turned part.
Key Capabilities
- T² chart and generalized variance (|S|) chart for the same subgrouped data, one above the other.
- Any number of variables (two or more), with equal-sized subgroups larger than the number of variables.
- T² limit at a chosen false alarm rate (default 0.0027, equivalent to 3σ).
- Phase 1 (limits from the data) or Phase 2 (limits from a historical mean vector and covariance matrix).
- Parameters estimated from chosen subgroups only, row subsets and an x-axis label column.
- Summary table and special-cause table for each chart.
Statistical Methods
The data hold p variables, measured on n parts in each of m subgroups. For each subgroup the tool computes the mean vector x̄ⱼ and the sample covariance matrix Sⱼ. In Phase 1 the process covariance is the pooled matrix S̄, the average of the Sⱼ, and the process centre is the grand mean x̿ of the subgroup means. Each subgroup's statistic is T²ⱼ = n·(x̄ⱼ − x̿)′ S̄⁻¹ (x̄ⱼ − x̿), the squared Mahalanobis distance of its mean from the centre, scaled by n. The upper control limit is UCL = p(m − 1)(n − 1) / (mn − m − p + 1) × F(1 − α; p, mn − m − p + 1), the lower limit is 0 and the centre line is the median of the same distribution, p(m − 1)(n − 1) / (mn − m − p + 1) × F(0.5; p, mn − m − p + 1), as in Minitab. With a historical mean vector and covariance matrix (Phase 2), these replace x̿ and S̄ and the UCL and centre line are the χ² quantiles χ²(1 − α; p) and χ²(0.5; p).
The generalized variance chart plots the determinant |Sⱼ| of each subgroup's covariance matrix, a single number for the joint spread of all the variables. With Σ̂ = |S̄| (or the determinant of the historical covariance matrix), and the constants b₁ = Π(n − i) / (n − 1)ᵖ and b₂ = Π(n − i) × [Π(n − i + 2) − Π(n − i)] / (n − 1)²ᵖ over i = 1 to p, the limits are CL = b₁Σ̂, UCL = Σ̂(b₁ + K√b₂) and LCL = max(0, Σ̂(b₁ − K√b₂)), with K = 3 by default (Montgomery's 3σ limits).
On both charts only points beyond the limits are signals; the run rules do not apply to these skewed statistics. A T² signal says the subgroup mean is off but not which variable moved: look at the subgroup's means against the others. The method assumes the variables are multivariate normal and the subgroups independent. Phase 1 limits include any out-of-control subgroups, so after removing assignable causes, recalculate with those subgroups omitted.
Input Fields & Options
Field | Description |
Variables | Required. Two or more numeric columns, the related characteristics measured on each part. |
Subgroup indicator | Required. Column giving the subgroup of each row. All subgroups must have the same size n, and n must be larger than the number of variables. |
Alpha (T² false alarm rate) | Default 0.0027; 0.0001 to 0.5. Sets the T² UCL only. |
Check Rule 1 (Generalized Variance) / K for Rule 1 (Generalized Variance) | Ticked, K = 3 by default. Unticked, points outside the generalized variance limits are not flagged. K sets the width of the generalized variance limits in standard deviations of |S|. The T² limit is set by Alpha. |
X scale | Optional column used to label the horizontal axis. |
Historical mean vector (T²) | Optional, one value per variable. Used for the T² chart only, and only together with a historical covariance matrix (Phase 2). |
Historical covariance matrix | Optional p × p matrix, rows separated by ";" and values by "," or spaces, e.g. 4.0,1.2;1.2,3.0. Used by the generalized variance chart on its own and by the T² chart together with the mean vector. |
Include or Exclude / Specify which rows | All rows by default, or include or exclude the row numbers given (e.g. 4 7 11:14). |
Specify subgroups to estimate parameters (mean vector & covariance matrix) / Subgroups | Omit (default) or Use the listed subgroups (e.g. 14:15) when estimating the centre and the pooled covariance; all subgroups are still plotted. |
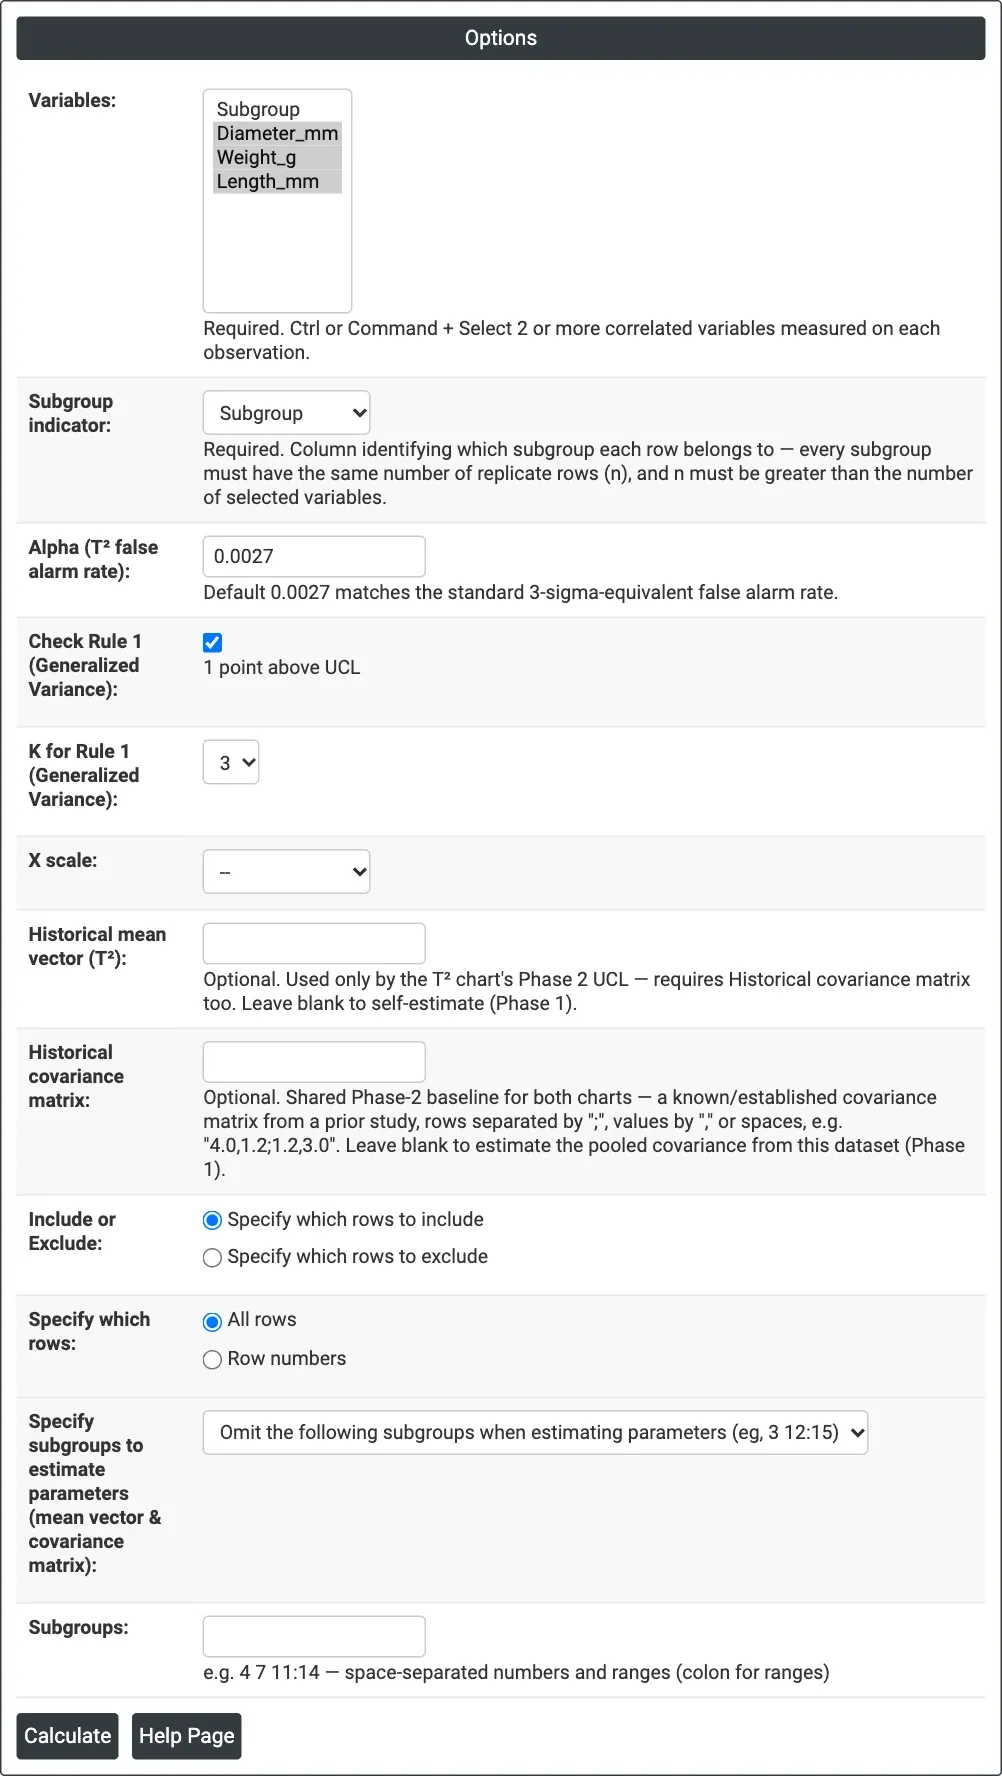
Figure 1 — Options for the example: Diameter_mm, Weight_g and Length_mm in subgroups of four parts, alpha 0.0027, Phase 1.
Output Descriptions
- T² Chart — T² for each subgroup with the centre line (the median of T²), UCL and LCL = 0; points above the UCL are red.
- T² summary table — Variables, p (variables), m (subgroups used), n (subgroup size), Alpha, Center Line (median of T²), UCL and Phase (1 self-estimated or 2 known baseline).
- Generalized Variance Chart — |S| for each subgroup with CL, UCL and LCL.
- Generalized variance summary table — Variables, p, m, n, the constants b1 and b2, CL, LCL, UCL and Phase.
- Nelson's Rules table for each chart — the subgroups above the UCL, or No special causes found.
- PDF export via Download.
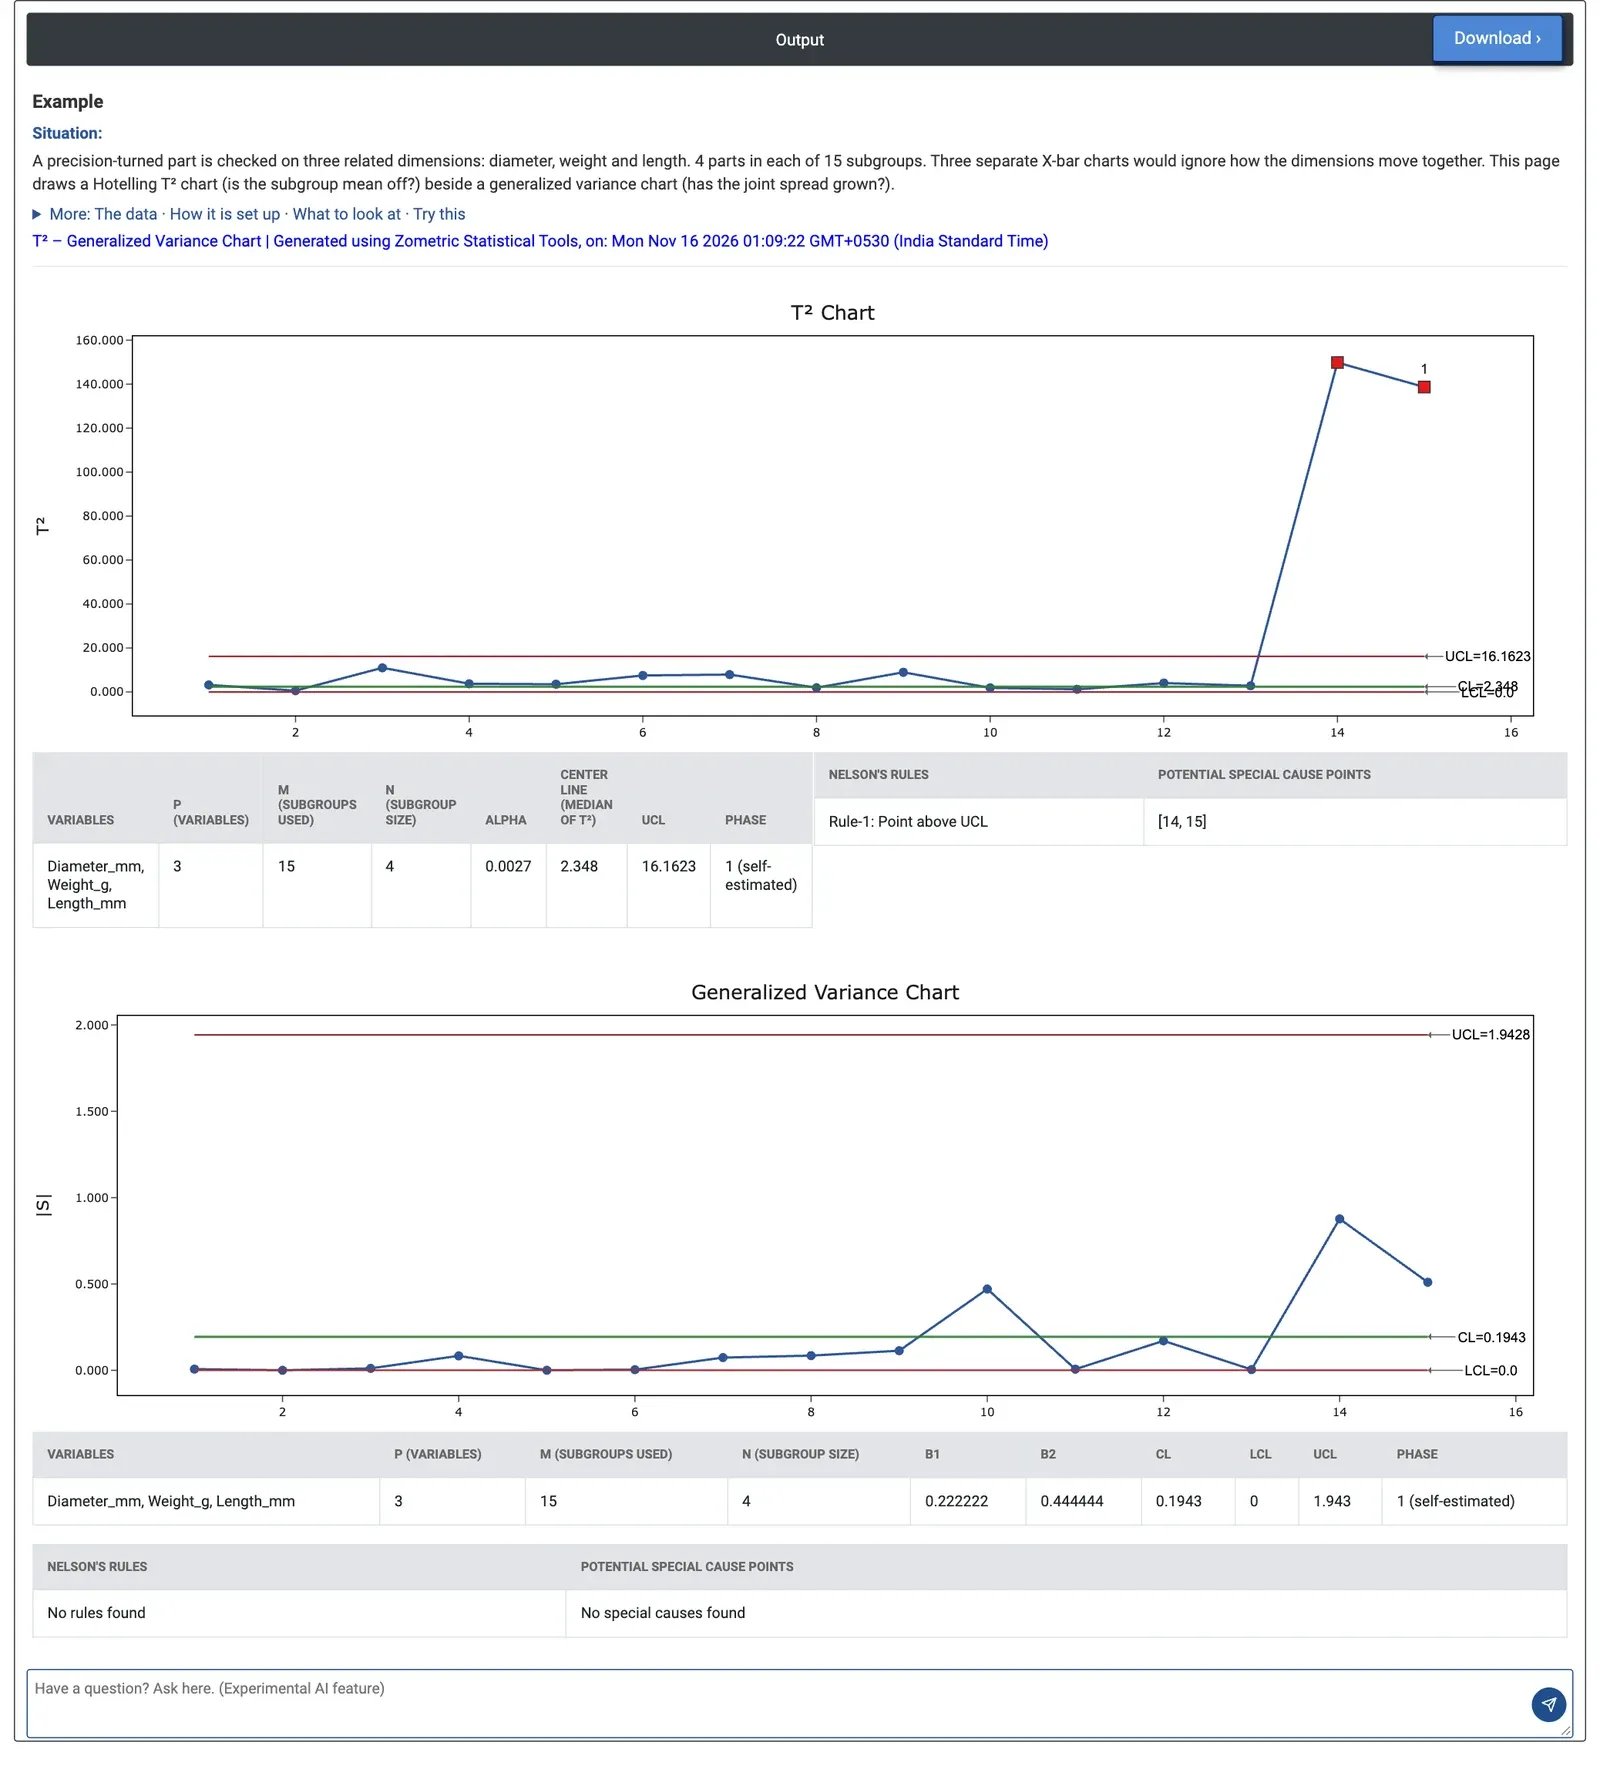
Figure 2 — Subgroups 14 and 15 are far above the T² UCL of 16.1623, while every |S| stays below the generalized variance UCL of 1.943.
Worked Example
A precision-turned part is checked on three related dimensions: diameter, weight and length. Four parts are taken in each of 15 subgroups. Diameter and length are strongly correlated (r = 0.83), so three separate Xbar charts would not judge the subgroups fairly. Variables = Diameter_mm, Weight_g and Length_mm, Subgroup indicator = Subgroup, Alpha = 0.0027, no historical values.
The T² chart has its UCL at 16.1623 with the centre line at 2.348. Subgroups 1 to 13 have T² between 0.58 and 10.99, but subgroups 14 and 15 reach 149.8 and 138.7 and are flagged. Their means show why: the diameter is 29.07 and 29.89 mm against about 24.4 to 25.3 mm before, and the length 13.73 and 14.35 mm against about 11.3 to 12.2 mm; subgroup 14 is also light at 55.9 g. The generalized variance chart has CL 0.1943 and UCL 1.943; the largest |S| is 0.877 at subgroup 14, so the joint spread has not grown enough to signal.
This is a shift of the process centre, not a more erratic process: the team should look for a setting or tooling change before subgroup 14 rather than for a source of extra variation. To get limits from the stable period, the analyst enters 14:15 in Subgroups with Omit. The T² UCL becomes 16.5221 (m = 13), and subgroups 14 and 15 still signal. The generalized variance limits tighten to CL 0.09013 and UCL 0.9013, and subgroup 14, at 0.877, is now only just below the UCL: worth watching, but still not a signal.