
Tally Individual Variables
On this page
Purpose
Tally Individual Variables counts how often each distinct value occurs in one or more columns and shows the result as a frequency table for each column. Use it for categorical data such as defect types, shifts, lines, suppliers or pass/fail results, and for discrete counts, to see which categories are most common and what share each one has, before drawing a Pareto chart or cross-tabulating two variables.
Key Capabilities
- One table per selected column; each column is tallied on its own.
- Counts, percents, cumulative counts and cumulative percents, in any combination.
- Works on text categories and on numbers (each distinct value is a category).
- Blank cells are left out of the counts.
Statistical Methods
For each selected column, the non-blank values are grouped by their distinct value, and the number of rows with each value is its count nⱼ. The total N = Σnⱼ is the number of non-blank cells in that column, so different columns can have different totals. The rows of the table are sorted by value: alphabetically for text, in increasing order for numbers.
Percent = 100 × nⱼ / N, rounded to two decimals. Cumulative count is the running total of the counts down the table, and cumulative percent is 100 × (running total) / N, which reaches 100 on the last row. Because the rows are in value order rather than by frequency, the cumulative columns are most useful for ordered values (for example a count of defects per unit, or ratings 1 to 5): they then give the share at or below each value. To rank categories by frequency and read off the share of the top few, use the Pareto Chart.
Each column is tallied independently, so the tables do not show how the variables relate to each other (for example which line makes which defect). For that, use Cross Tabulation and Chi-Square.
Input Fields & Options
Field | Description |
Variables | Required. One or more columns (Ctrl or Cmd to select several). A separate table is generated for each. |
Counts | Ticked by default. Number of rows with each value. |
Percents | Off by default. Each value's share of the column's non-blank rows. |
Cumulative counts | Off by default. Running total of the counts, in table order. |
Cumulative percents | Off by default. Running total as a percentage, in table order. At least one of the four statistics must be ticked. |
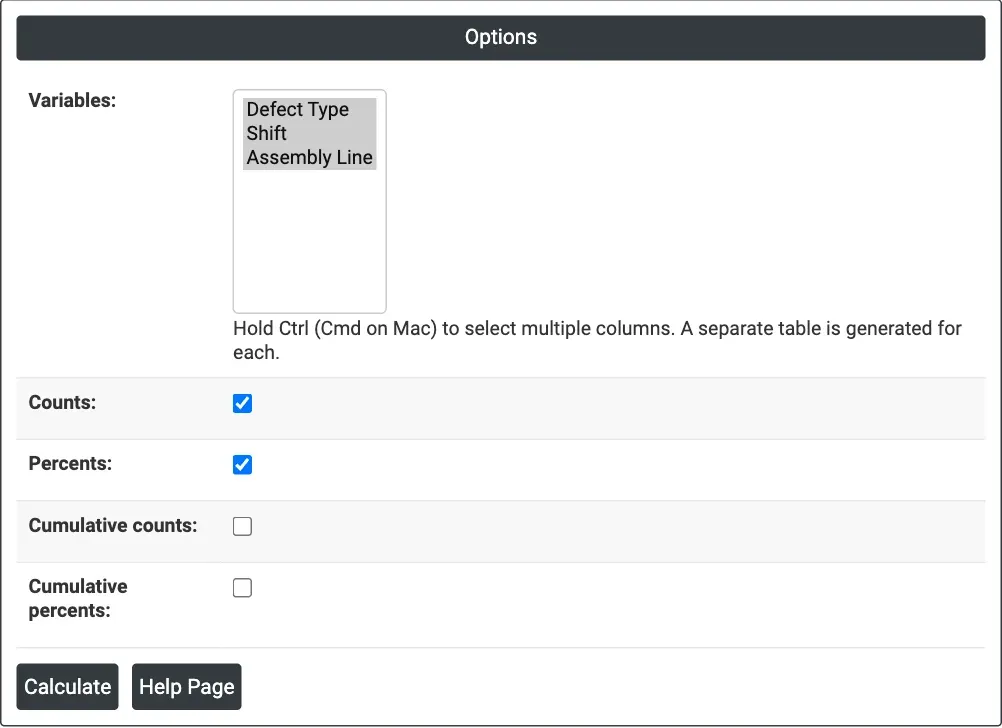
Figure 1 — Options for the example: Defect Type, Shift and Assembly Line, with Counts and Percents.
Output Descriptions
- Tally for <column> — one table per selected column, with the distinct values and the chosen columns: Count, Percent, CumCount and CumPercent.
- PDF export via Download.
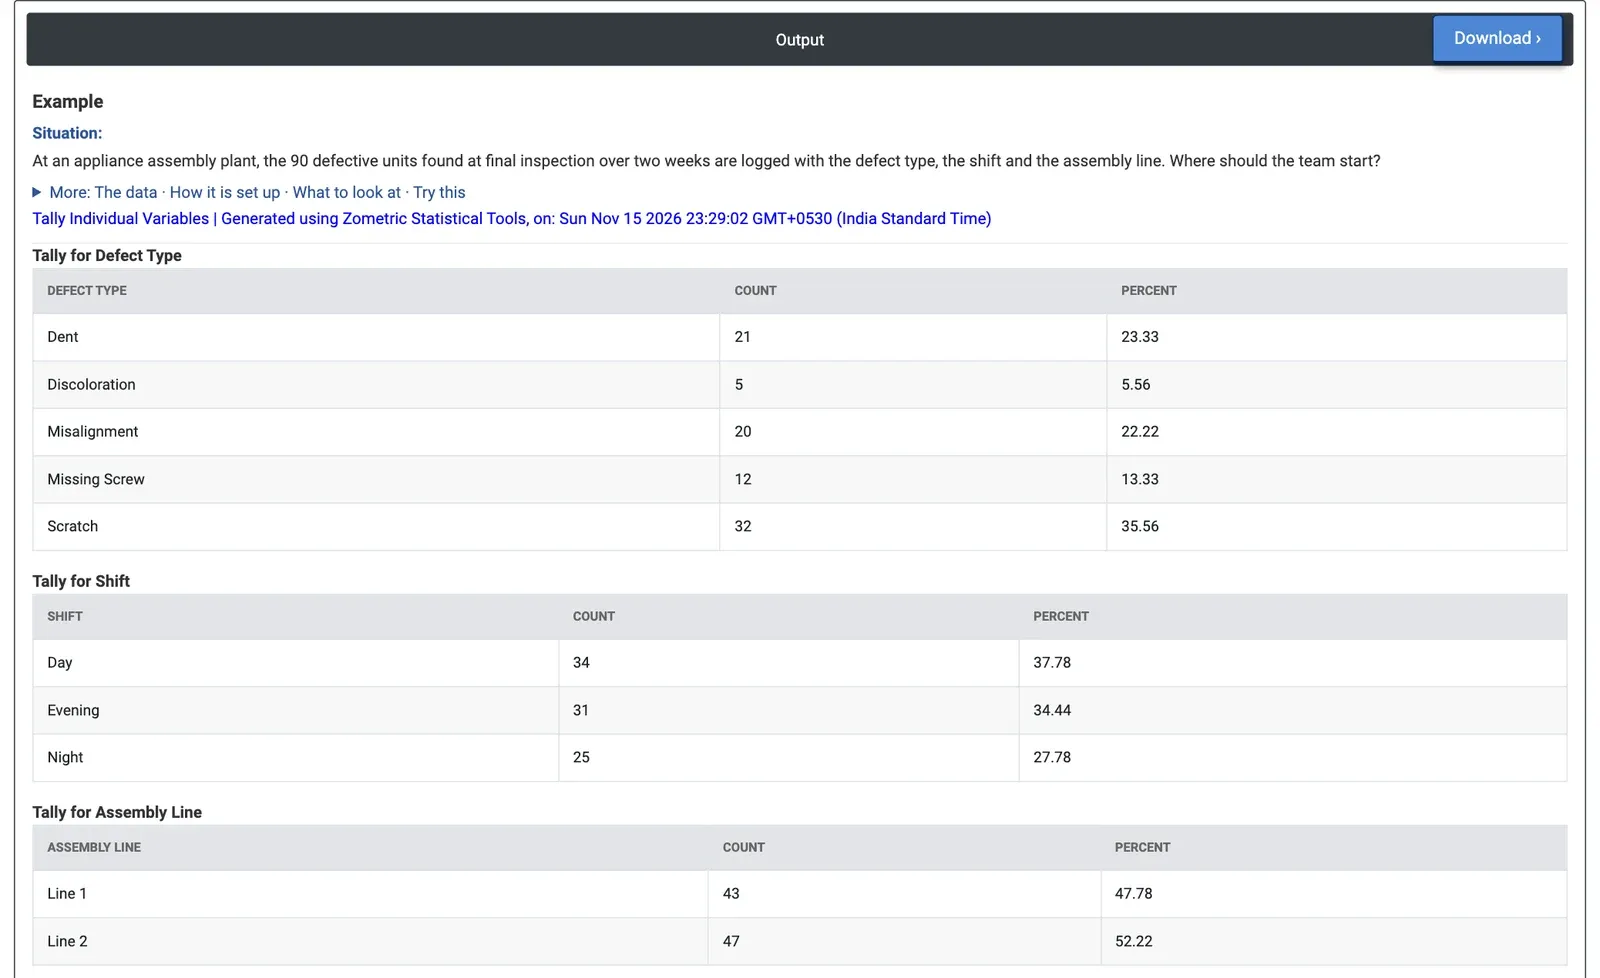
Figure 2 — Counts and percents of 90 defective units by defect type, shift and assembly line.
Worked Example
At an appliance assembly plant, the 90 defective units found at final inspection over two weeks are logged with the defect type, the shift and the assembly line. The quality team wants a quick summary to decide where to start. Variables = Defect Type, Shift and Assembly Line, with Counts and Percents ticked.
Scratch is the most common defect (32 units, 35.56%), followed by Dent (21, 23.33%) and Misalignment (20, 22.22%); together these three account for 73 of the 90 defects, about 81%. Missing Screw (12) and Discoloration (5) are smaller. By shift the defects are spread fairly evenly: Day 34, Evening 31 and Night 25. By line they are about equal: Line 1 has 43 and Line 2 47.
The team should start with scratches, then dents and misalignment. Since neither shift nor line stands out on its own, the next step is to look at the combinations: a cross tabulation of Defect Type by Assembly Line shows that Line 2 makes 21 of the 32 scratches, while Line 1 makes 14 of the 20 misalignments, so the two lines have different problems even though their totals are similar. Ticking Cumulative percents here would add a running total in alphabetical order (Dent, Discoloration, Misalignment and so on), which is not a ranking; a Pareto Chart of Defect Type gives the ranked view.