
Tasks
On this page
Purpose
Tasks keeps an improvement project's task list: what has to be done, by whom, between which dates, how far it has got and how urgent it is. The list lives in the worksheet, one task per row; the tool tidies it into the All Tasks table, draws a Gantt chart with a line at today's date, and checks the list for entries it cannot read. Use it to run the weekly project review and to show the sponsor where the plan stands.
Key Capabilities
- All Tasks table with Subject, Status, Assigned To, Start Date, Due Date, Completion Date, % Complete, Description, Comments and Priority.
- All Tasks Gantt Chart: one bar per task from its start to its due date, with a dotted Today line.
- Task names on the Gantt chart cut to a length you choose, so long subjects do not squeeze the chart.
- Sensible defaults for blank cells: Status Not Started, % Complete 0%, Priority Normal.
- Check the Task List: flags unknown statuses, % Complete values that are not numbers, and due dates before start dates.
- PDF export via Download.
Statistical Methods
The tool does no calculation beyond reading the list. Columns are matched by heading, ignoring case: Subject (also Task or Activity, required), Status, Assigned To (also Owner, Responsible or Who), Start Date (or Start), Due Date (also Due, End, End Date or Finish), Completion Date (also Completion or Completed On), % Complete (also Percent Complete or Progress), Description, Comments and Priority. Rows with a blank Subject are skipped.
Status should be one of Not Started, In Progress, Completed, Waiting or Deferred (any capitalisation), and Priority one of Highest, High, Normal, Low or Lowest. % Complete may be written 40, 40% or 0.4 (a decimal between 0 and 1 is read as a fraction). Dates may be Excel date numbers, ISO dates (2026-11-16) or day-first dates (16/11/2026), and are shown as day-month-year. Only tasks with both a start and a due date appear on the Gantt chart; every bar is grey, and the Today line is drawn at the date the report is created. The tool does not compare status with dates, so a task past its due date and not Completed is for the reader to spot on the chart.
Input Fields & Options
Field | Description |
Project Name | Shown at the top of the report. Its help text lists the worksheet columns: Subject, Status (Not Started, In Progress, Completed, Waiting, Deferred), Assigned To, Start Date, Due Date, Completion Date, % Complete, Description, Comments and Priority (Highest, High, Normal, Low, Lowest). |
Number of characters to display on Gantt chart | Task names longer than this are cut on the chart's axis. Default 25; 1 to 200. |
Worksheet | One task per row with the columns above. Load Example fills in a task list. |
Create report | Lays out the task list and draws the Gantt chart. |
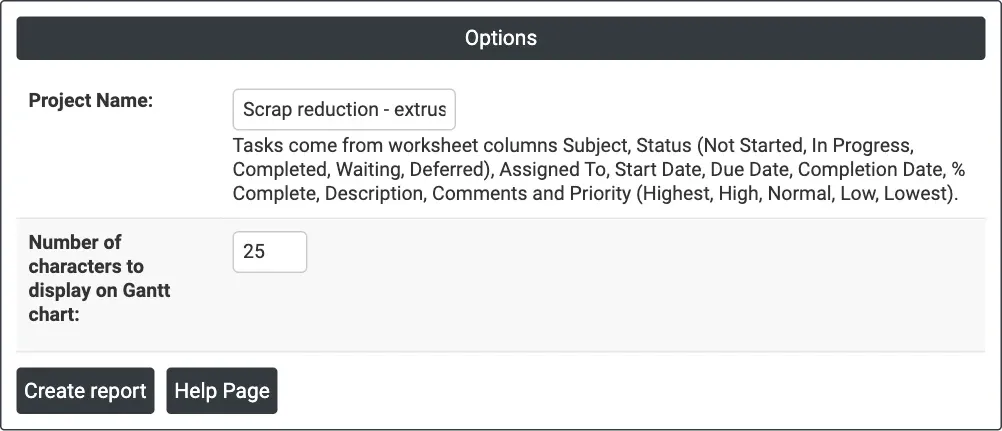
Figure 1 — Options for the example: the project name and the default 25 characters on the Gantt chart.
Output Descriptions
- Tasks — the Project Name.
- All Tasks Gantt Chart — one grey bar per task from start date to due date, first task at the top, with a dotted red Today line; hovering a bar shows the dates, status and % complete.
- All Tasks — the task list with all ten columns.
- Check the Task List — problems found in the list (shown only when there are any).
- PDF export via Download.
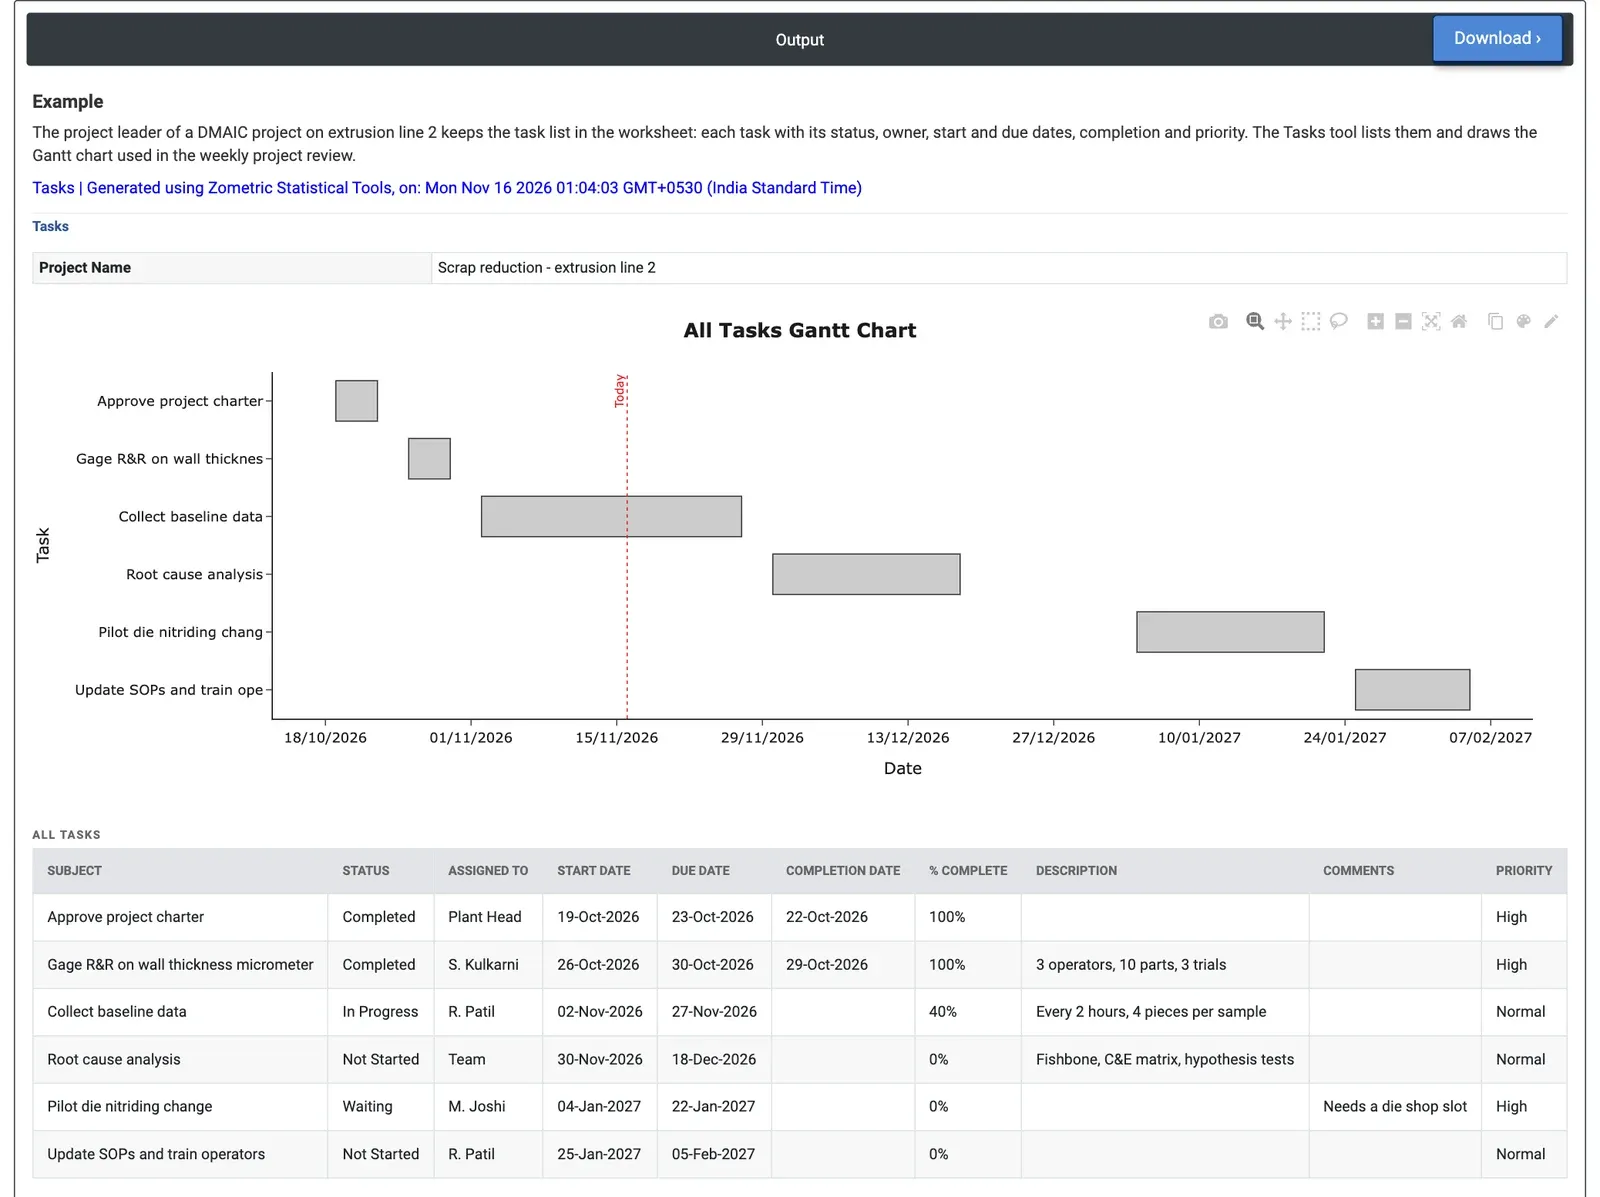
Figure 2 — Task list of the extrusion line 2 project: six tasks from charter approval in October 2026 to SOP updates and training in February 2027, with the Today line on 16-Nov-2026 in the middle of the baseline data collection.
Worked Example
The leader of a DMAIC project on extrusion line 2 keeps the project's six tasks in the worksheet and creates the report for the weekly review, here on 16-Nov-2026. The Gantt chart runs from charter approval (19-Oct to 23-Oct-2026) to updating the SOPs and training the operators (25-Jan to 05-Feb-2027), with the Today line across the third task, collecting the baseline data.
Two tasks are Completed, both a day early: the charter was approved on 22-Oct-2026 and the Gage R&R on the wall thickness micrometer (3 operators, 10 parts, 3 trials) finished on 29-Oct-2026. Collecting the baseline data started on 02-Nov-2026 and is In Progress at 40%, due on 27-Nov-2026: more than half of its time has passed, so it is slightly behind and worth a question in the review. Root cause analysis follows (30-Nov to 18-Dec-2026, Not Started). The die nitriding pilot (04-Jan to 22-Jan-2027, High priority) is Waiting, with the comment “Needs a die shop slot”: that is the main item for the review, because the pilot drives everything after it. The leader asks the die shop for a January slot now, and no Check the Task List table appears, so every status, date and percentage in the list was read correctly.