
Tolerance Interval (Nonnormal Distribution)
On this page
Purpose
A tolerance interval gives the range that, with a stated confidence, contains at least a stated percentage of all the units in the population, for example: with 95% confidence, at least 95% of bulbs last longer than 1,093 hours. Tolerance Interval (Nonnormal Distribution) does this for data that are not normally distributed, such as lifetimes, strengths or impurity levels. It fits a chosen distribution and also gives a nonparametric interval that needs no distribution at all, so you can compare the two. Use it to set or check specification limits, warranty periods or release limits from a sample.
Key Capabilities
- Eight distributions: Weibull, Lognormal, Gamma, Exponential, Smallest extreme value, Largest extreme value, Logistic and Loglogistic, or Assume none for the nonparametric interval only.
- Nonparametric (distribution-free) interval from the ordered data, with its achieved confidence, shown in every case.
- Two-sided interval, lower bound or upper bound.
- Anderson-Darling goodness-of-fit test and the fitted parameters, to check the distribution chosen.
- Several columns at once, each with its own interval and histogram with the tolerance limits marked.
Statistical Methods
Nonparametric method: the limits are order statistics of the sample. For a two-sided interval the tool uses (x₍ᵣ₎, x₍ₙ₋ᵣ₊₁₎), with r the largest value for which the achieved confidence, P(Beta(n − 2r + 1, 2r) > P), is still at least the confidence level, where P is the minimum proportion of the population. For a one-sided bound it uses x₍ₖ₎ (lower) or x₍ₙ₋ₖ₊₁₎ (upper), with k chosen the same way from the binomial distribution. Because only whole order statistics can be used, the achieved confidence is usually above the level asked for; with a small sample it can be below it, even with the minimum and maximum, and the table then shows the lower value.
Distribution methods, with parameters from maximum likelihood: Lognormal uses the normal tolerance interval of the log data, transformed back; Gamma uses the normal interval of the cube root of the data (Wilson-Hilferty); Exponential uses exact chi-square limits for one-sided bounds and the Fernandez method for two-sided; Weibull (on the log scale), Smallest and Largest extreme value use Lawless's exact method; Logistic and Loglogistic use the Bain and Engelhardt large-sample method. A two-sided interval is built from one-sided limits at α/2 and (1 + P)/2. Lognormal, Gamma, Exponential, Weibull and Loglogistic need positive data.
A distribution interval is only as good as the fit: check that the Anderson-Darling p-value is not small (above 0.05, say) before relying on it. When no distribution fits, use the nonparametric interval, which needs a larger sample to reach the same confidence. The achieved confidence applies only to the nonparametric method.
Input Fields & Options
Field | Description |
Sample data | Required. One or more numeric columns; each gets its own interval. |
Distribution | Weibull (default), Lognormal, Gamma, Exponential, Smallest extreme value, Largest extreme value, Logistic, Loglogistic, or Assume none, which shows only the nonparametric interval. |
Confidence level | Default 95; 50 to 99.99. |
Minimum percentage of population in interval | Default 95; 50 to 99.99. The proportion of the population the interval must contain. |
Tolerance Interval | Two-sided (default), Lower bound or Upper bound. |
Tolerance Interval Plot | Ticked by default: a histogram of each column with the tolerance limits. |
Data Options: Subset (optional) | Exclude matching rows (default) or Include only matching rows, by row numbers (e.g. 3,7,12-15) and/or a condition. |
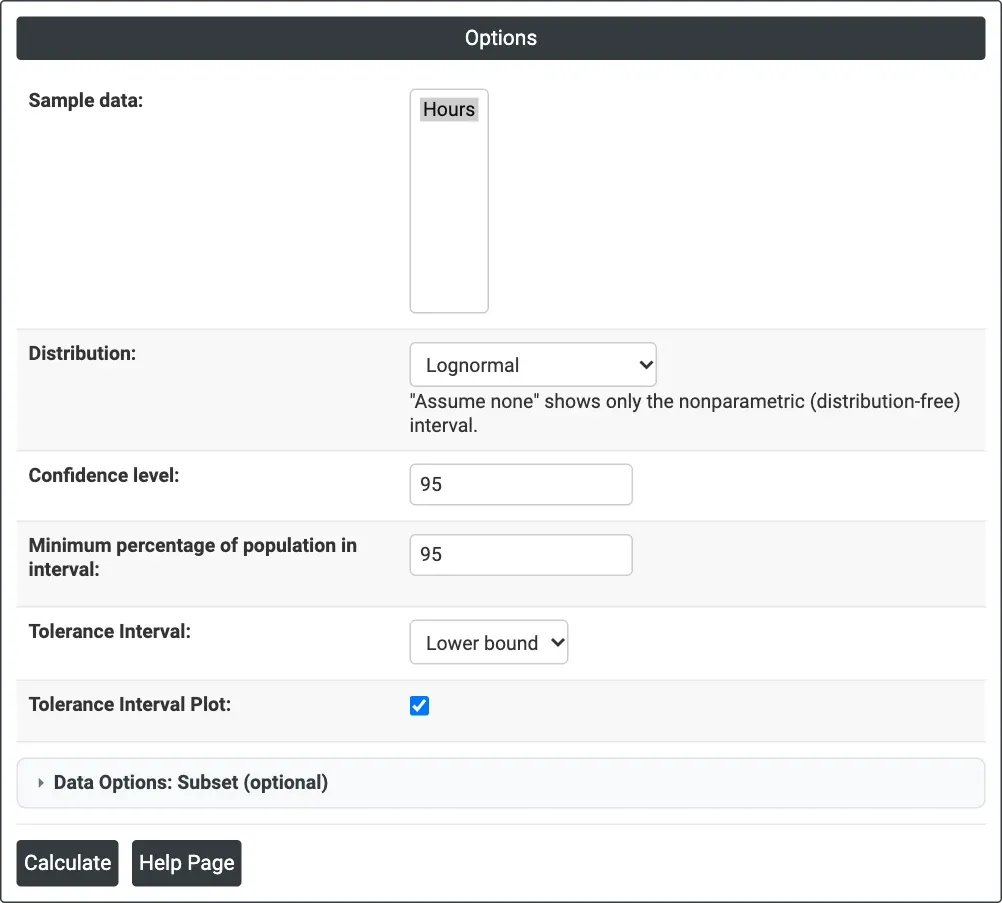
Figure 1 — Options for the example: Hours, Lognormal, 95% confidence, at least 95% of the population, lower bound.
Output Descriptions
- Settings — distribution, confidence level and percent of population in interval.
- Statistics — Variable, N, Mean and StDev for each column.
- Tolerance table — for each column the interval or bound from the chosen distribution's method, the Nonparametric Method and its Achieved Confidence (with Assume none: Lower Bound, Upper Bound and Achieved Confidence).
- Tolerance Interval for <column> — histogram with the limits drawn as dashed lines (the distribution method's limits when a distribution is chosen).
- Distribution Parameters — the fitted parameters, e.g. Location and Scale, or Shape and Scale.
- Goodness-of-Fit Test (Anderson-Darling) — AD statistic and p-value for the distribution chosen.
- PDF export via Download.
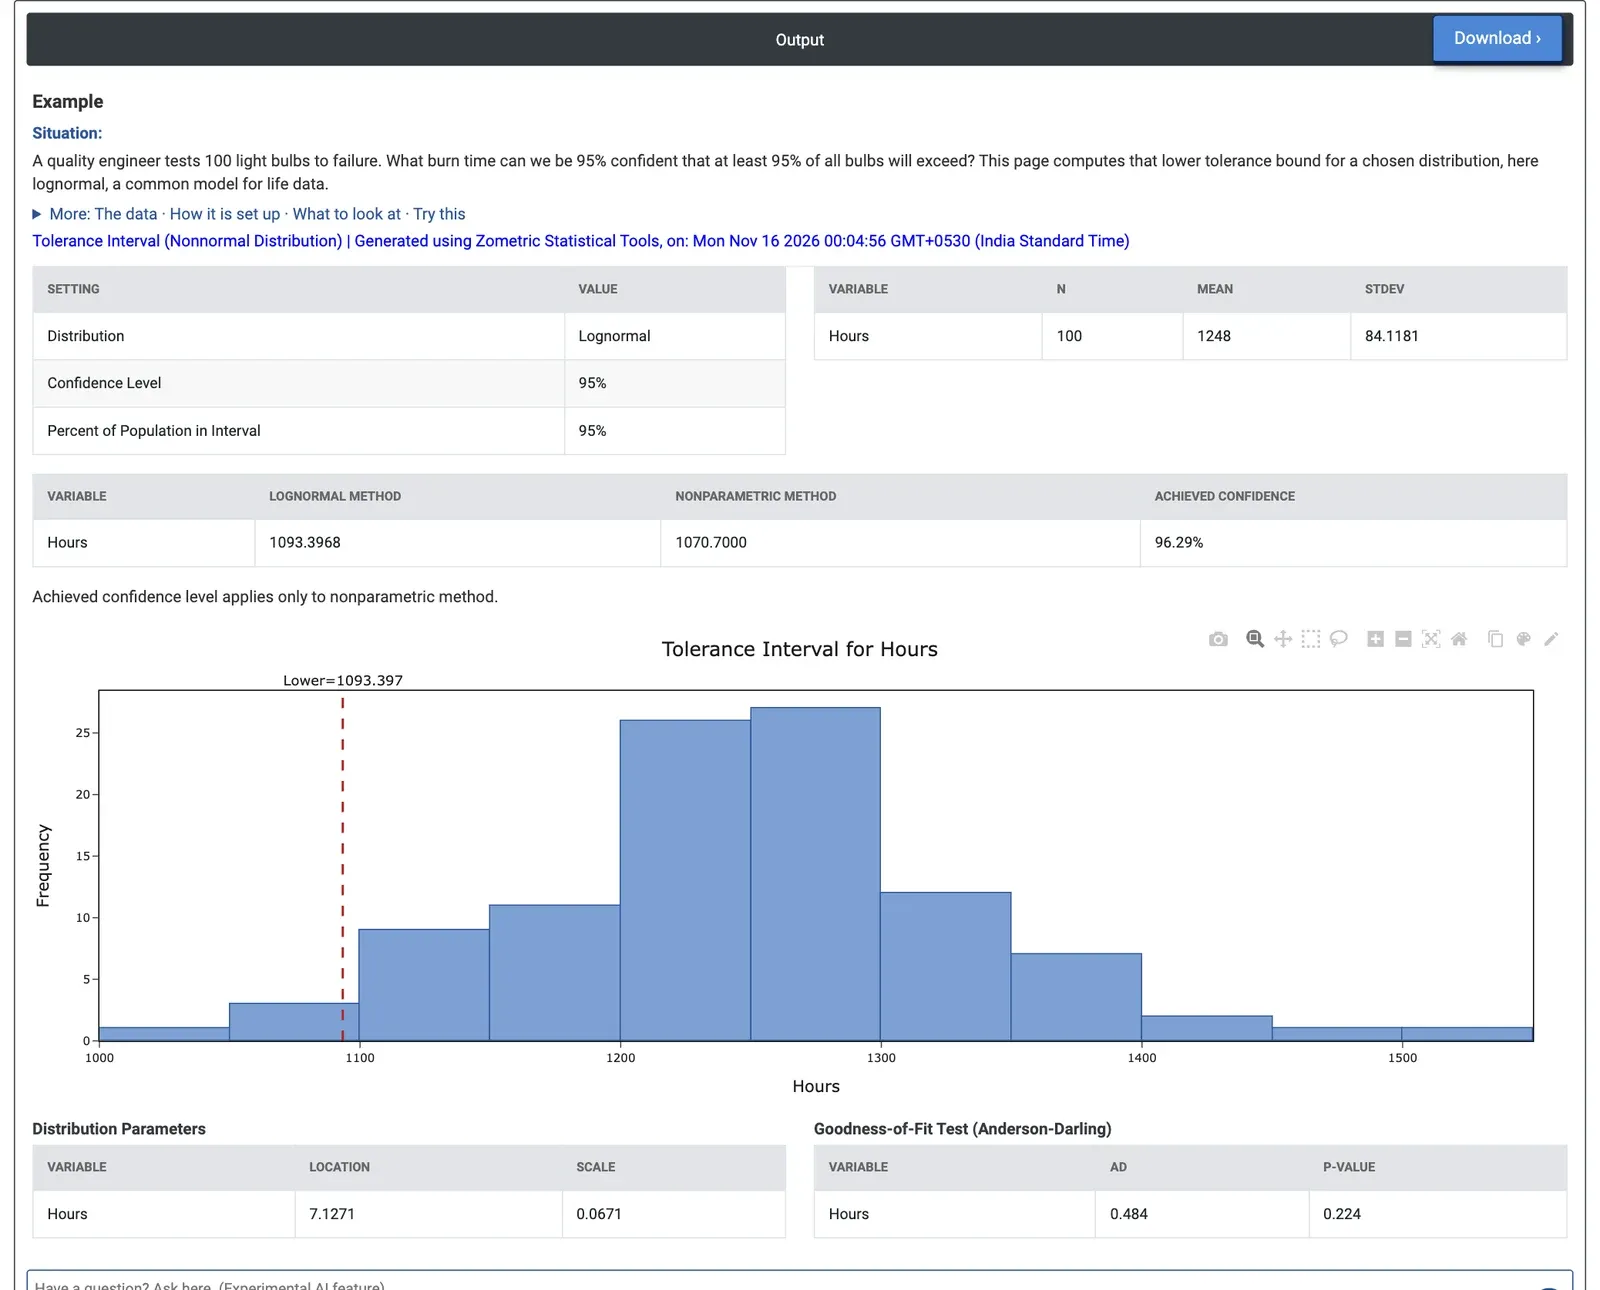
Figure 2 — Lognormal lower bound of 1,093.40 hours and nonparametric bound of 1,070.70 hours (achieved confidence 96.29%); the lognormal fits (AD 0.484, p = 0.224).
Worked Example
A quality engineer tests 100 light bulbs to failure and wants to state a burn time that, with 95% confidence, at least 95% of all bulbs will exceed. Lifetimes are often skewed, so the engineer fits a lognormal distribution. Sample data = Hours, Distribution = Lognormal, Confidence level = 95, Minimum percentage of population in interval = 95, Tolerance Interval = Lower bound.
The 100 bulbs have a mean of 1,248 hours and a standard deviation of 84.1 hours. The lognormal fits well (location 7.1271, scale 0.0671; AD 0.484, p = 0.224). The lognormal lower bound is 1,093.40 hours: with 95% confidence, at least 95% of bulbs last longer than that. The nonparametric bound, the second-shortest life in the sample, is 1,070.70 hours with an achieved confidence of 96.29%. It is lower because it uses no model, but it supports the same order of claim.
The choice of distribution matters. A Weibull does not fit these bulbs (AD 1.558, p < 0.010) and would give a lower bound of only 1,017.99 hours; a Gamma fits (AD 0.442, p > 0.250) and gives 1,091.16 hours, close to the lognormal. The engineer can state about 1,090 hours with confidence, and should not use the Weibull figure. For a two-sided interval with the lognormal, 95% of bulbs fall between 1,070.95 and 1,447.79 hours (nonparametric: 1,044.33 to 1,510.35, the shortest and longest lives).