
Value Stream Map
On this page
Purpose
A Value Stream Map shows how material flows through a process from supplier to customer, how long each step takes, how much stock waits between steps, and how little of the total lead time actually adds value. The tool draws a current-state map from one worksheet row per process, works out the takt time from the customer demand and the working time, turns the inventory into waiting time, and sums the timeline into lead time and % value added. It also flags any step that cannot keep up with demand. Use it in Lean and Six Sigma projects to find where time and stock pile up before deciding what to improve.
Key Capabilities
- Value stream map drawn in the standard symbols: supplier and customer factories, production control, a process box and data box per step, inventory triangles and the lead-time ladder.
- Takt time from customer demand per day, week, month or year and the shift pattern.
- Inventory before each step converted into hours of waiting, and finished goods inventory after the last step.
- VSM Timeline Summary: total cycle time, value-added and non-value-added time, lead time and % value added.
- Check Against Takt Time: lists steps whose cycle time is above the takt time.
- Process and Inventory Data table, and PDF export via Download.
Statistical Methods
Hours/Day = (Hours/Shift − Break Min./Shift / 60) × Shifts/Day. The available days in the demand period are 1 for /day, Days/Week for /week, Days/Month for /mo and Days/Month × 12 for /yr, and Takt Time (min) = available days × Hours/Day × 60 / customer demand. For each process, Inv Time (hr) = inventory waiting before it × takt / 60: the time the stock takes to be used at the customer's rate. If VA CT or NVA CT is missing, VA CT defaults to the cycle time and NVA CT to cycle time − VA CT; a missing cycle time is VA CT + NVA CT.
Total CT, Total VA CT and Total NVA CT are the sums of the step times in hours. Lead Time (day) = (sum of inventory hours, including finished goods, + Total CT) / Hours/Day, and % Value Added = Total VA CT / (Lead Time × Hours/Day) × 100. Without a customer demand there is no takt time, so inventory cannot be turned into time and the lead time and % value added are shown as *. A step whose cycle time is above the takt time cannot meet demand at the stated working time, and is listed under Check Against Takt Time.
Input Fields & Options
Field | Description |
Supplier / Customer / Control | Names on the supplier, customer and production control boxes. Defaults Supplier, Customer and Production Control. The help text lists the worksheet columns: Process, Cycle Time (min), VA CT, NVA CT, Changeover, Operators, Uptime %, Yield.TP %, Defect %, Inventory (units waiting before the process). |
Cust. Demand | Customer demand in units per period; needed for takt time and lead time. |
Demand per | /day, /week, /mo (default) or /yr. |
Hours/Shift / Shifts/Day / Break Min./Shift | Working pattern. Defaults 8 hours, 1 shift, 0 minutes. |
Days/Week / Days/Month | Working days. Defaults 5 and 20. |
Finished goods inventory (optional) | Units waiting after the last process, before shipping. |
Worksheet | One process per row in flow order. Load Example fills in a six-step extrusion line. |
Calculate | Draws the map and computes the tables. |
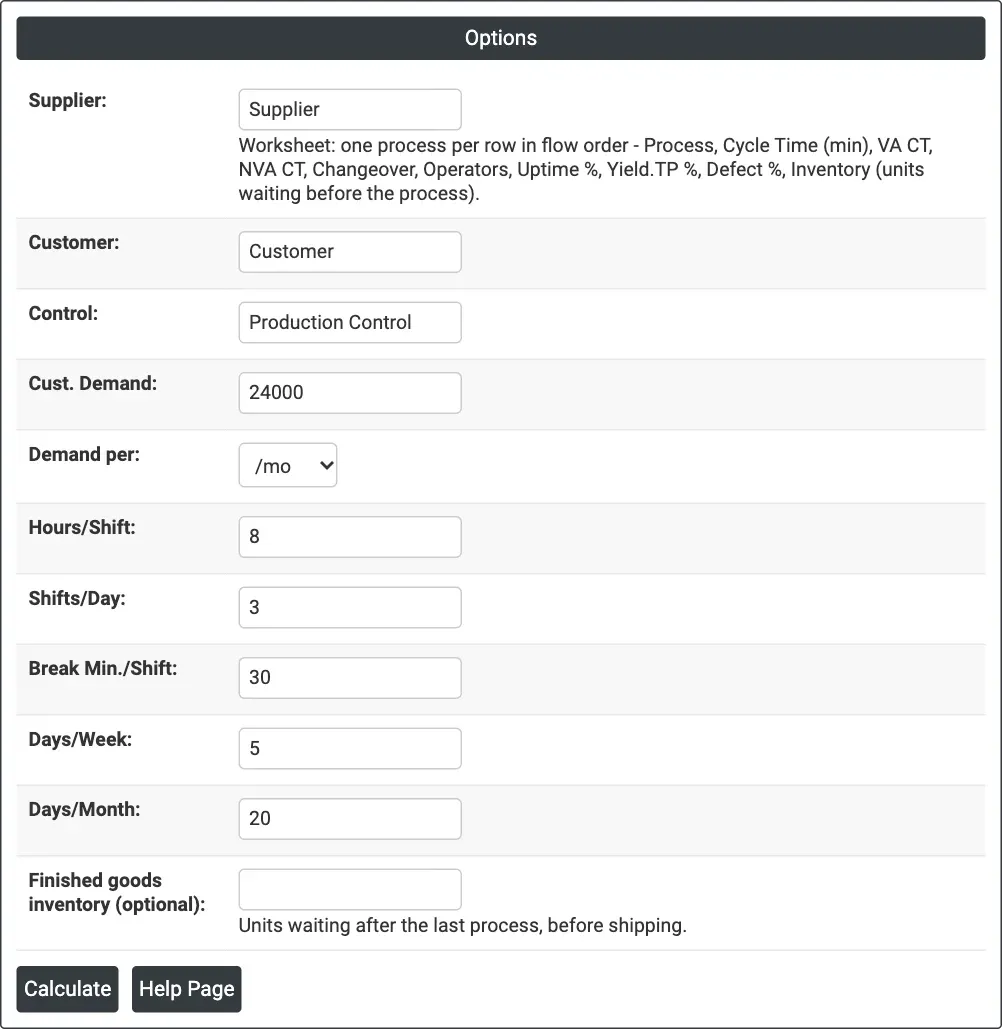
Figure 1 — Options for the example: demand of 24,000 per month, three 8-hour shifts with 30 minutes of breaks, 20 days a month.
Output Descriptions
- Value Stream Map (takt time … min) — the map: supplier, production control and customer, each process with its data box (C/T, VA CT, C/O, uptime, yield), inventory triangles with units and hours, and the timeline with waiting days above and cycle times below, ending in a box with lead time and total CT, VA CT and NVA CT.
- Takt Time & Facility Data — demand, shift pattern, Hours/Day and Takt Time (min).
- VSM Timeline Summary — Total CT (hr), Total VA CT (hr), Total NVA CT (hr), Lead Time (day) and % Value Added.
- Process and Inventory Data — per process: cycle, VA and NVA times, changeover, operators, uptime, yield, defect %, inventory before and Inv Time (hr).
- Check Against Takt Time — steps slower than takt (shown only when there are any).
- PDF export via Download.
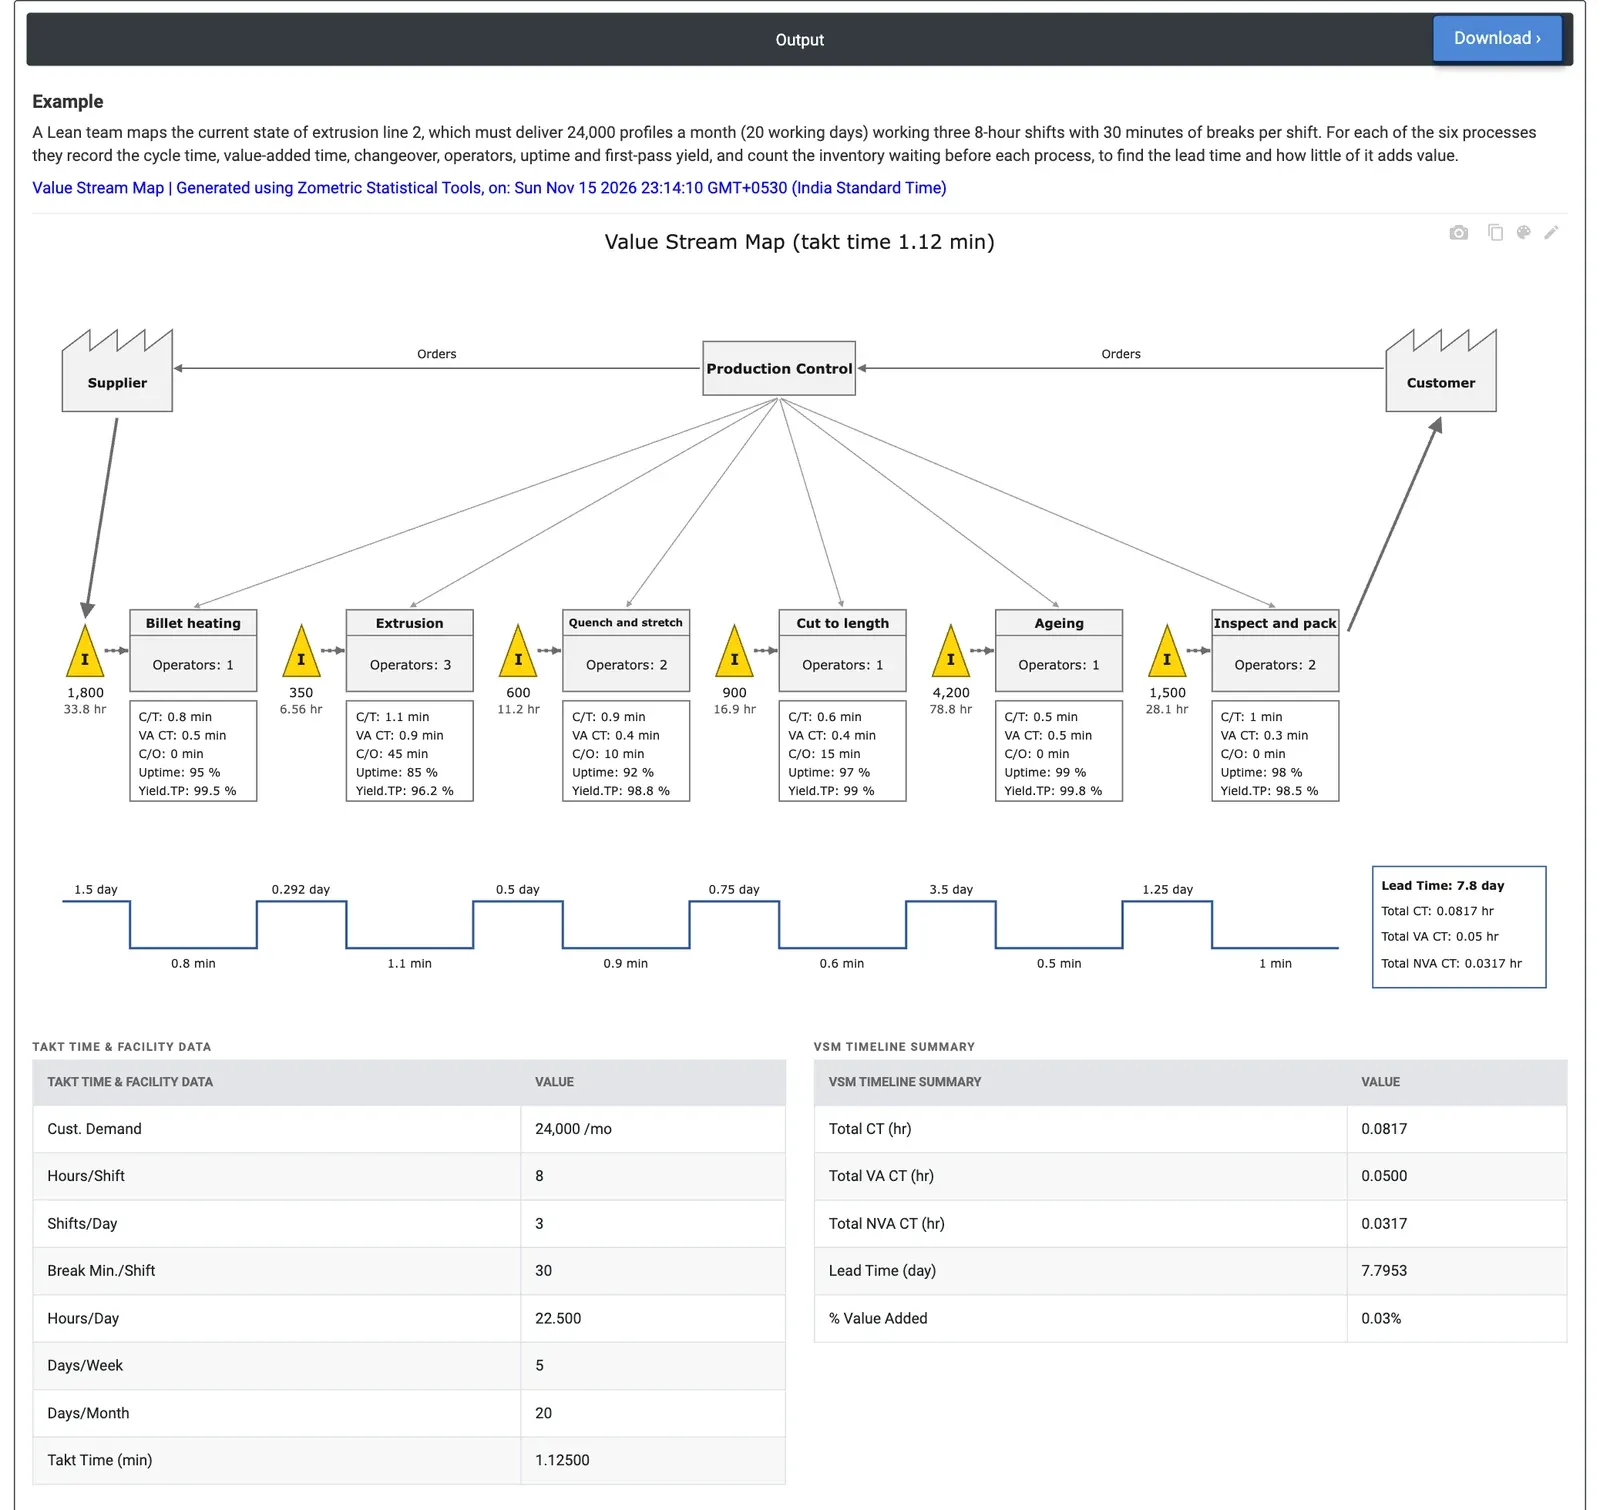
Figure 2 — Current-state map of extrusion line 2: takt time 1.125 min, lead time 7.8 days, of which only 0.05 hours adds value.
Worked Example
A Lean team maps the current state of extrusion line 2, which must deliver 24,000 profiles a month over 20 working days, on three 8-hour shifts with 30 minutes of breaks each. For six processes, billet heating to inspect and pack, they record cycle time, value-added time, changeover, operators, uptime and first-pass yield, and count the stock waiting before each process.
Hours/Day is 22.5 and the takt time is 1.125 min. Every cycle time is below takt; the slowest step, extrusion at 1.1 min, has almost no margin, and with its 45-minute changeovers and 85% uptime it is the step to watch. The stock tells the real story: 4,200 profiles before ageing are 78.75 hours of waiting, 1,800 billets before heating 33.75 hours and 1,500 profiles before packing 28.1 hours. In all, the lead time is 7.8 days while the total cycle time is 0.0817 hours (4.9 minutes), of which 0.05 hours (3 minutes) adds value: 0.03% value added. The team's first targets are the stock before ageing and before heating, not the cycle times. If demand rose to 30,000 a month, takt would fall to 0.9 min and Check Against Takt Time would flag extrusion (1.1 min) and inspect and pack (1.0 min) as unable to keep up.