
Variability Chart
On this page
Purpose
The Variability Chart shows every individual response value at each level of a factor, with the mean of each level joined by a line. A second factor can split the data further, with its own colour and mean line. In one picture you see how much the mean shifts between levels and how much the values spread within each level. Use it to compare batch types, machines, operators or parts, and to see whether a difference in means is large compared with the scatter inside each group.
Key Capabilities
- One column of points per level of Factor 1 on the X axis, spread slightly sideways so they do not overlap.
- Mean of each level marked with a diamond and joined by a line.
- Optional Factor 2: one colour, mean line and legend entry per level, so you can see whether the factors interact.
- Every value shown, so outliers and unequal spreads are visible straight away.
- Rows can be excluded or kept by row number or condition.
Statistical Methods
Rows with a blank or non-numeric response or a blank factor are dropped. The levels of each factor are sorted in numeric order when they are all numbers (1, 2, … 10) and alphabetically otherwise. For each level of Factor 1 (and each level of Factor 2, when set), the tool plots all the response values at that level's position, with a small random horizontal offset of up to ±0.12 of the spacing so equal values remain visible, and computes the arithmetic mean of the group.
For each level of Factor 2 (or for all the data, when Factor 2 is empty) the group means are joined across the levels of Factor 1. Reading the chart: a steep mean line means Factor 1 changes the average response; tall columns of points mean large variation within groups. With Factor 2, mean lines that are roughly parallel mean the effect of Factor 1 is the same at every level of Factor 2; lines that cross or converge suggest an interaction.
The chart is descriptive and gives no test. To decide whether the differences in means are statistically significant, use a two-sample t-test or ANOVA; to split total variation into components, as in a measurement system study, use Gage R&R or a nested ANOVA.
Input Fields & Options
Field | Description |
Response | Required. Numeric column plotted on the Y axis. |
Factor 1 (X-axis) | Required. Column whose levels form the X axis. |
Factor 2 (optional, grouped/colored) | Optional. Column whose levels are drawn in different colours, each with its own mean line and a legend. |
Title | Title of the chart. Default “Variability Chart”. |
Data Options: Subset (optional) | Exclude matching rows (default) or Include only matching rows; Row numbers (e.g. 3,7,12-15) and/or a Condition (e.g. Tensile_Strength_MPa > 900) select the rows. |
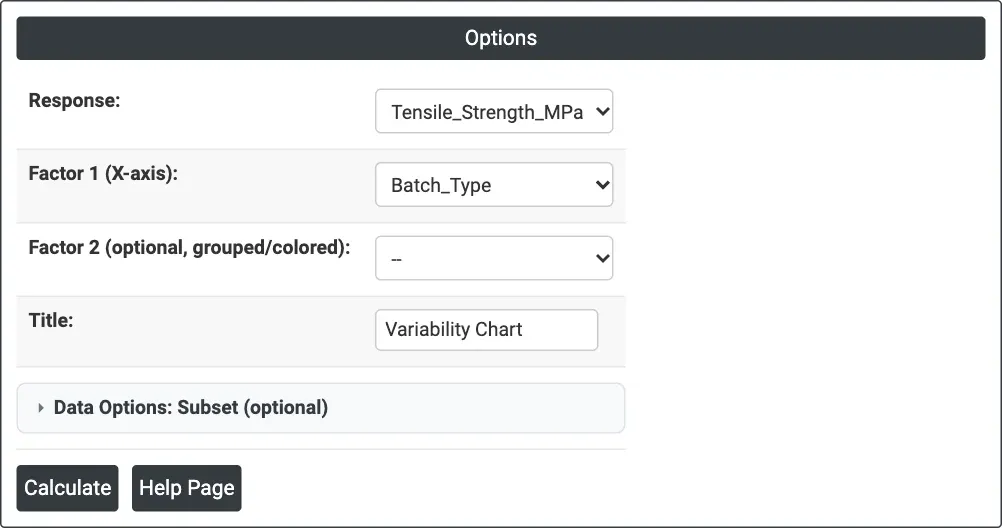
Figure 1 — Options for the example: Response = Tensile_Strength_MPa, Factor 1 = Batch_Type, no Factor 2.
Output Descriptions
- Variability Chart — the individual response values for each level of Factor 1, the level means as diamonds joined by a line, and with Factor 2 one colour and mean line per level and a legend.
- PDF export via Download.
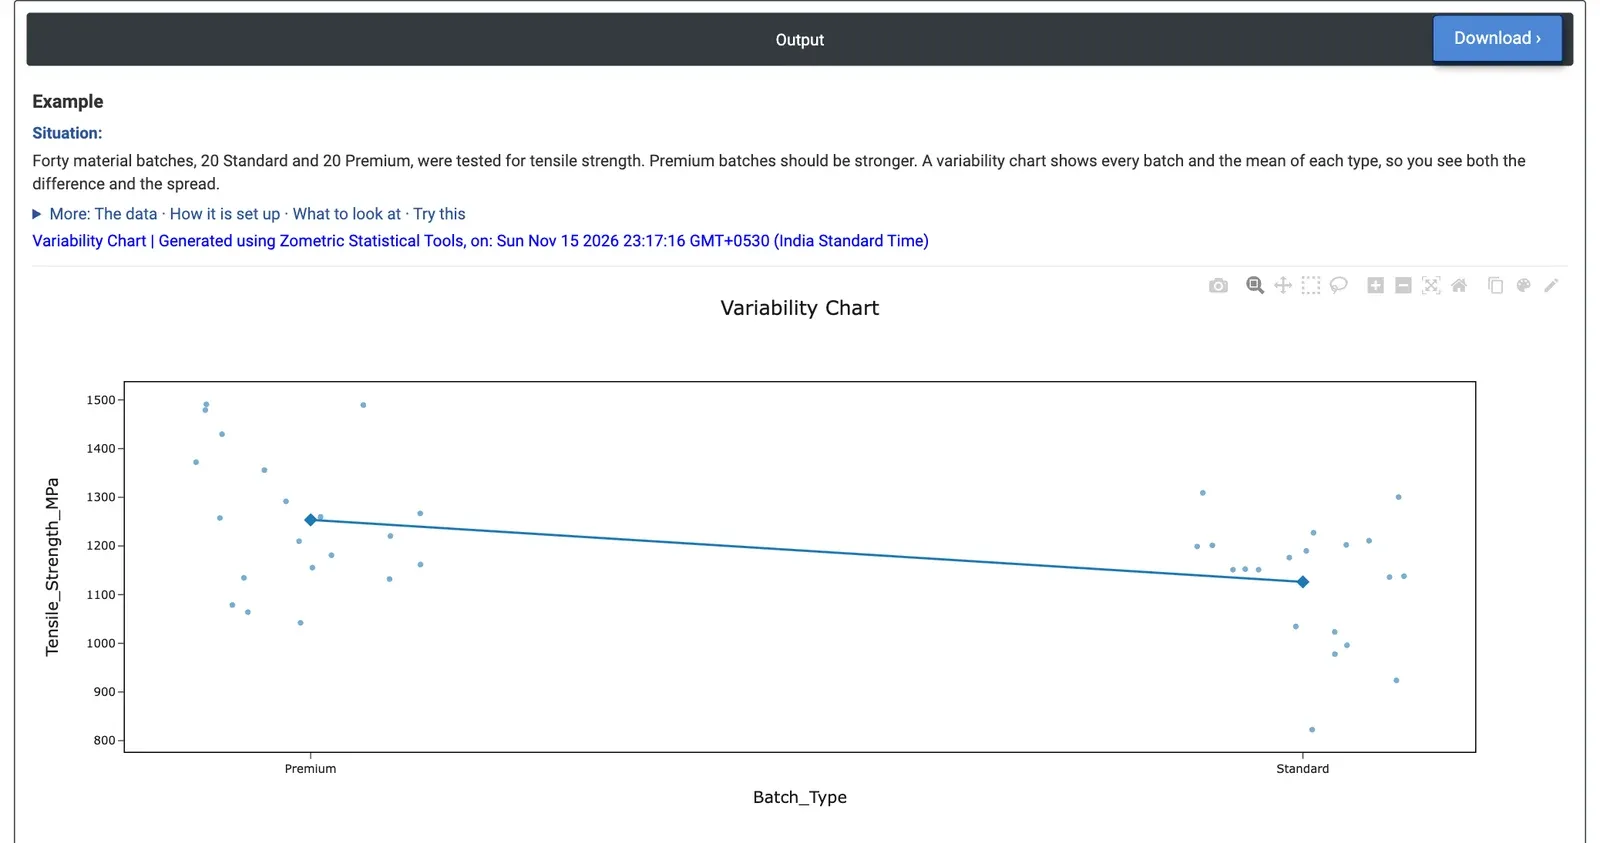
Figure 2 — Tensile strength of 20 Premium and 20 Standard batches, with the two means joined.
Worked Example
Forty material batches, 20 Standard and 20 Premium, were tested for tensile strength. Premium batches are sold as stronger, and the quality team wants to see both the difference and the spread. Response = Tensile_Strength_MPa, Factor 1 (X-axis) = Batch_Type, Factor 2 left empty because there is no second grouping in this data.
The mean line falls from Premium (1253.6 MPa) to Standard (1126.2 MPa), a difference of about 127 MPa. The spread inside each type is large: Premium runs from 1042.1 to 1490.9 MPa and Standard from 822.6 to 1309.1 MPa, so the two clouds overlap widely. 14 of the 20 Standard batches are stronger than the weakest Premium batch. The lowest point, 822.6 MPa (Standard), sits well below the rest of its group and is worth checking for a special cause.
A two-sample t-test on the same data gives p = 0.005, so the difference in means is real. But for a customer who needs a minimum strength, the overlap matters more than the means: choosing Premium does not guarantee a stronger batch. The team would look at what drives the batch-to-batch variation within each type before relying on the grade alone.