
Zone Chart
On this page
Purpose
The Zone Chart monitors the mean of a process with one simple rule instead of a set of run tests. Each subgroup mean (or individual value) gets a score according to the zone it falls in, measured in standard deviations from the centre line, and the scores add up while the points stay on the same side. When the running score reaches the critical value, the point signals. A single point far out signals at once, and so does a run of points that are only moderately off-centre. Use it as an easy-to-read alternative to an Xbar or I chart with the Western Electric zone tests.
Key Capabilities
- Works with subgroups (two or more columns, one subgroup per row) or with individual values (one column).
- Standard deviation from the pooled standard deviation, Rbar or Sbar for subgroups, or the average or median moving range or the square root of MSSD for individuals; or a known mean and standard deviation.
- Adjustable zone weights (default 0, 2, 4 and 8); the zone 4 weight is the critical value for a signal.
- Optional reset of the cumulative score after each signal.
- Running score printed above every point, signalling points in red and listed in a table.
- Parameters estimated from chosen subgroups only, row subsets and a custom x-axis label column.
Statistical Methods
The centre line is the mean of the subgroup means (or of the individual values), unless a Process mean is entered. The process standard deviation σ comes from the Process sd entered or from the chosen method. For subgroups: Pooled Stdev is √[Σ(nᵢ − 1)sᵢ² / Σ(nᵢ − 1)], divided by c₄ when Use unbiasing constant is ticked; Rbar is based on the subgroup ranges and d₂ (R̄ / d₂ for equal subgroup sizes); Sbar is s̄ / c₄ (or the plain mean of the subgroup standard deviations without the unbiasing constant). For individuals: average moving range MR̄ / d₂, median moving range / d₄, over the Length of moving range, or the square root of MSSD. The standard deviation of a plotted mean is σ / √n̄, where n̄ is the average subgroup size.
Each point is turned into z = (x̄ − centre line) / (σ / √n̄) and scored by its zone: |z| ≤ 1 gets the Zone 1 weight, 1 to 2 the Zone 2 weight, 2 to 3 the Zone 3 weight and beyond 3 the Zone 4 weight. The score is added to the running total while consecutive points stay on the same side of the centre line; a point on the other side starts a new total with its own score. A Zone 1 point adds nothing but does not reset the total either. A point signals when the running total reaches the Zone 4 weight (8 by default), so one point beyond 3σ, two points between 2σ and 3σ, or four points between 1σ and 2σ on the same side all give a signal. This is Jaehn's zone control chart; with the default weights it approximates the combined effect of the Western Electric zone tests. Without the reset option, every following point on the same side also signals while the total stays at or above the critical value.
Input Fields & Options
Field | Description |
Columns | Required. Two or more numeric columns for subgroups (each row is one subgroup), or a single column for individual values. |
Process mean / Process sd | Optional. Known values used instead of estimating from the data. |
Std Dev Estimation method | Pooled Stdev (default), Rbar or Sbar when two or more columns are selected; Average moving range, Median moving range or Square Root of MSSD when one column is selected. |
Use unbiasing constant | Ticked by default. Applies to the Pooled Stdev, Sbar and Square Root of MSSD methods. |
Length of moving range | Default 2; 2 to 100. Individual values only. |
Zone 1 weight / Zone 2 weight / Zone 3 weight / Zone 4 weight | Scores for a point within 1σ, between 1σ and 2σ, between 2σ and 3σ and beyond 3σ. Defaults 0, 2, 4 and 8. The Zone 4 weight must be above 0: it is the score at which a point signals. |
Reset cumulative score after each signal | Off by default. When ticked, the running score restarts at zero after a signal, so only new evidence can give the next signal. |
Show decimals | Decimals shown for the centre line and the table, 1 to 7 (default 3). |
X scale | Optional column used to label the horizontal axis (e.g. time stamps). |
Chart title / Subtitle 1 / Subtitle 2 | Optional. Default title: Zone Chart. |
Include or Exclude / Specify which rows | All rows by default, or include or exclude the row numbers given (e.g. 4 7 11:14). |
Specify subgroups to estimate parameters / Subgroups | Omit (default) or Use the listed subgroups (e.g. 3 12:15) when estimating the centre line and σ; all subgroups are still plotted and scored. |
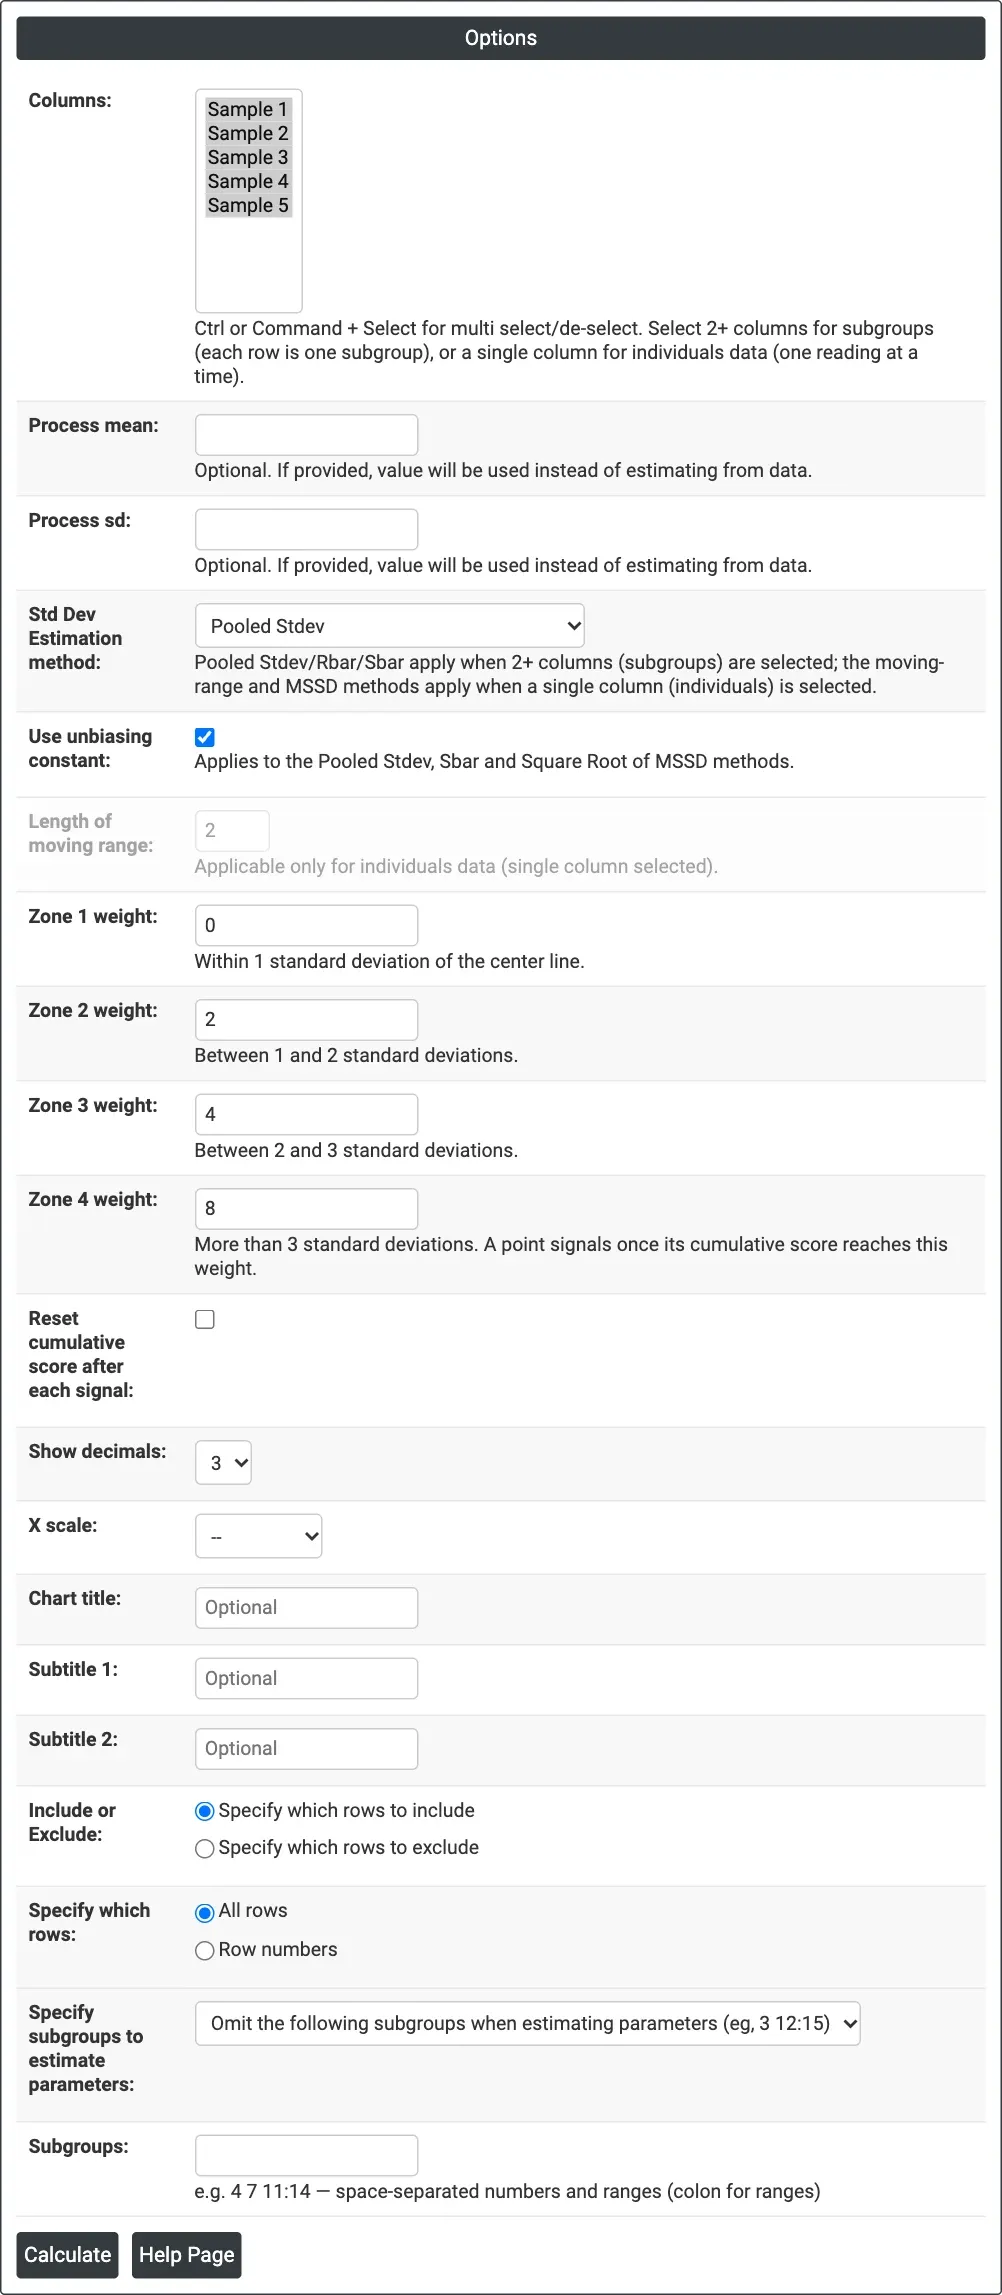
Figure 1 — Options for the example: camshaft lengths in Sample 1 to Sample 5, pooled standard deviation and the default zone weights 0, 2, 4 and 8.
Output Descriptions
- Zone Chart — the subgroup means (or individual values) in order, with the centre line (X̄) and lines at ±1σ, ±2σ and ±3σ of the plotted mean; the running zone score is printed above each point and signalling points are red.
- Signals table — Subgroup (or Observation), Subgroup Mean (or Value) and Cumulative Zone Score for every point that signalled; negative scores are below the centre line.
- PDF export via Download.
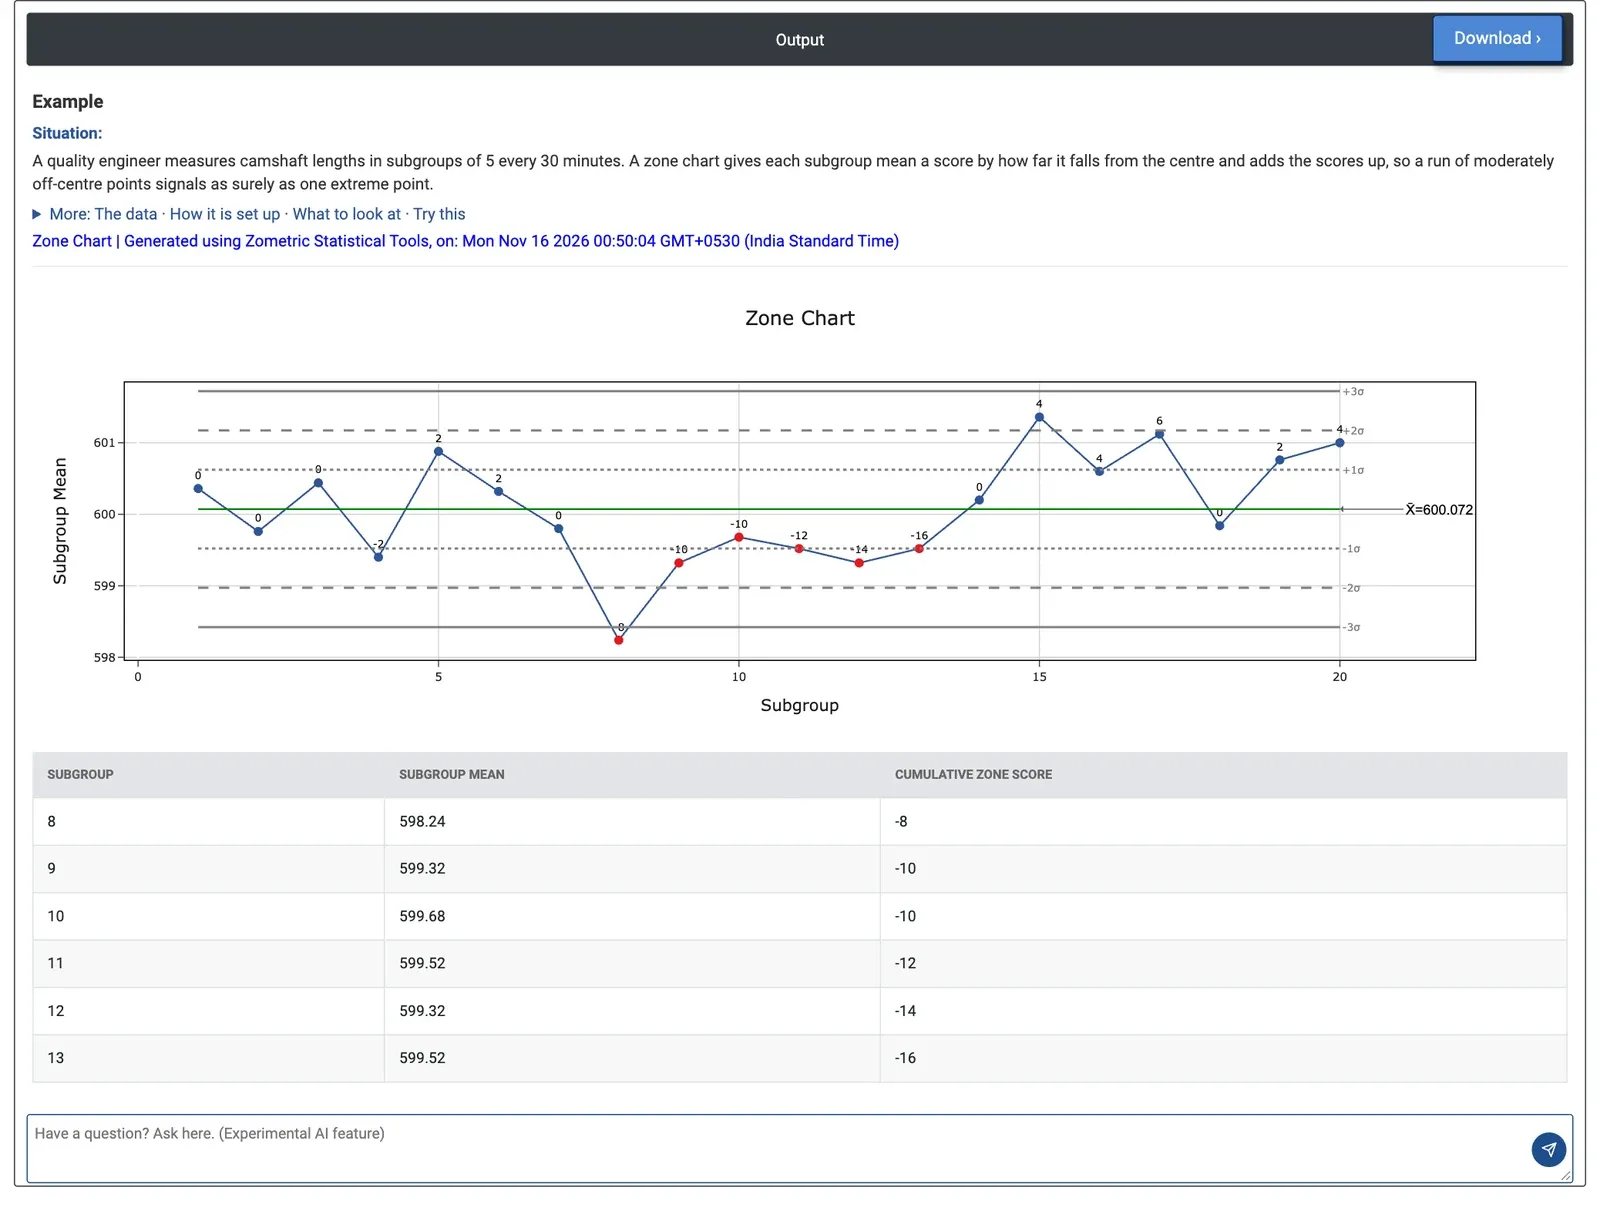
Figure 2 — Zone chart of 20 subgroups of five camshaft lengths: subgroup 8 falls below −3σ and the score stays at −8 or lower up to subgroup 13.
Worked Example
A quality engineer measures the length of five camshafts every 30 minutes, 20 subgroups in all, and wants a chart the operators can read without learning eight run rules. Columns = Sample 1 to Sample 5, Std Dev Estimation method = Pooled Stdev with the unbiasing constant, zone weights 0, 2, 4 and 8, no reset.
The centre line is 600.072 mm. The pooled standard deviation is about 1.230 mm, so the plotted means have σ = 1.230 / √5 = 0.550 mm and the zone lines lie at 599.522 and 600.622 (±1σ), 598.972 and 601.172 (±2σ) and 598.422 and 601.722 (±3σ). Subgroup 8 has a mean of 598.24 mm, beyond −3σ, and scores −8 at once: a signal. Subgroups 9 to 13 (means 599.32 to 599.68 mm) all stay below the centre line, so the score keeps falling to −16 and each of them is listed in the signals table. Subgroup 15 (601.36 mm) is beyond +2σ but scores only 4, and the high side never reaches 8.
The process ran short for about three hours from subgroup 8, the same shift the Xbar chart shows with its run rules. With Reset cumulative score after each signal ticked, the table lists only subgroups 8 (−8) and 13 (−8): after the restart, the five moderately low means from subgroup 9 to 13 (scores 2, 0, 2, 2 and 2) were enough for a second signal. That confirms the low period was not just one bad subgroup, and the team should look for a cause that started around subgroup 8, such as a tool change or a setting adjusted at that time.