
Friedman Test
The Friedman test is a nonparametric test for three or more related treatments. Each block, such as a subject, batch or company, must receive every treatment once. The test ranks the responses within each block and compares the rank sums of the treatments. It needs no normality assumption. In Zometric you give one stacked column each for Response, Treatment and Blocks. The result is a chi-square statistic and a p-value, with a median and rank sum per treatment.
Last reviewed
Key takeaway
The Friedman test checks whether three or more treatments differ when each block (subject, batch or company) is measured under every treatment, by ranking the responses within each block.
On this page
What is the Friedman Test?
The Friedman test compares three or more related treatments. "Related" means that the same blocks (for example subjects, batches, days or companies) are measured under every treatment. It is the nonparametric counterpart of a repeated-measures or randomized-block ANOVA, so it does not need normally distributed data.
The test works on ranks. Within each block it ranks the responses from the smallest to the largest, using average ranks for ties. Then it adds up the ranks for each treatment. If the treatments do not differ, the rank sums should be about equal. If one treatment is always ranked high and another low, the rank sums are far apart and the test shows a significant difference.
Because each block is compared only with itself, differences between blocks are removed from the comparison. A block with generally high values does not hide a treatment effect.
The null hypothesis is that all treatment effects are zero. The alternative is that not all treatment effects are zero.
When to use it
Use the Friedman test when:
- You compare three or more treatments, methods, conditions or time points.
- Every block is measured under every treatment, exactly once.
- The response is numeric (continuous or ordinal), such as a rating, a score or a measurement.
- The data are not normal, are skewed or have outliers, or the response is only ordinal.
Typical examples: the same panel of tasters rating several recipes, several advertising channels tested at the same companies, several machines run on the same batches of material.
Check that:
- Each block has one value for each treatment. If a block has a missing or repeated treatment, the tool stops with an error.
- Blocks are independent of each other. Only the treatments within a block are related.
- There are enough blocks. The p-value uses a chi-square approximation, which is less reliable when there are very few blocks. Use more blocks when you can.
When not to use it, and what to use instead:
- The groups are independent, with no blocking: use the Kruskal-Wallis Test.
- There are only two related conditions: use the Paired T Test if the differences are roughly normal. If not, use the One Sample Wilcoxon Test or the One Sample Sign Test on the paired differences.
- The data are roughly normal and you want a parametric test: use the General Linear Model with the treatment and the block as factors.
Data you need
The tool needs stacked data: one row per observation, and three columns.
- Response: the measured value. It must be numeric.
- Treatment: which treatment was applied.
- Blocks: which block the value belongs to.
Every block must appear once under every treatment. Do not put the treatments side by side in separate columns. This is the layout of the example below, with 12 companies and 3 advertising types.
Response | Company | Advtype |
|---|---|---|
7.2 | 1 | direct-mail |
9.4 | 2 | direct-mail |
… | … | … |
10.1 | 1 | magazine |
8.2 | 2 | magazine |
… | … | … |
15.7 | 1 | newspaper |
… | … | … |
The three columns must be different columns. The Treatment and Blocks columns can hold numbers or text. Rows with a missing value in any of the three columns are left out, and if that leaves a block incomplete, the tool reports an error.
If your data are in a wide layout, with one column per treatment and one row per block, stack them first. In the Statistical Workspace, use Data ▾ and choose Stack Columns….
How to run the Friedman Test in Zometric
Sign in to Zometric Statistical Software. You can run the Friedman Test in the Statistical Workspace, where most people work, or on its own tool page.
In the Statistical Workspace
- Open Statistical Workspace.
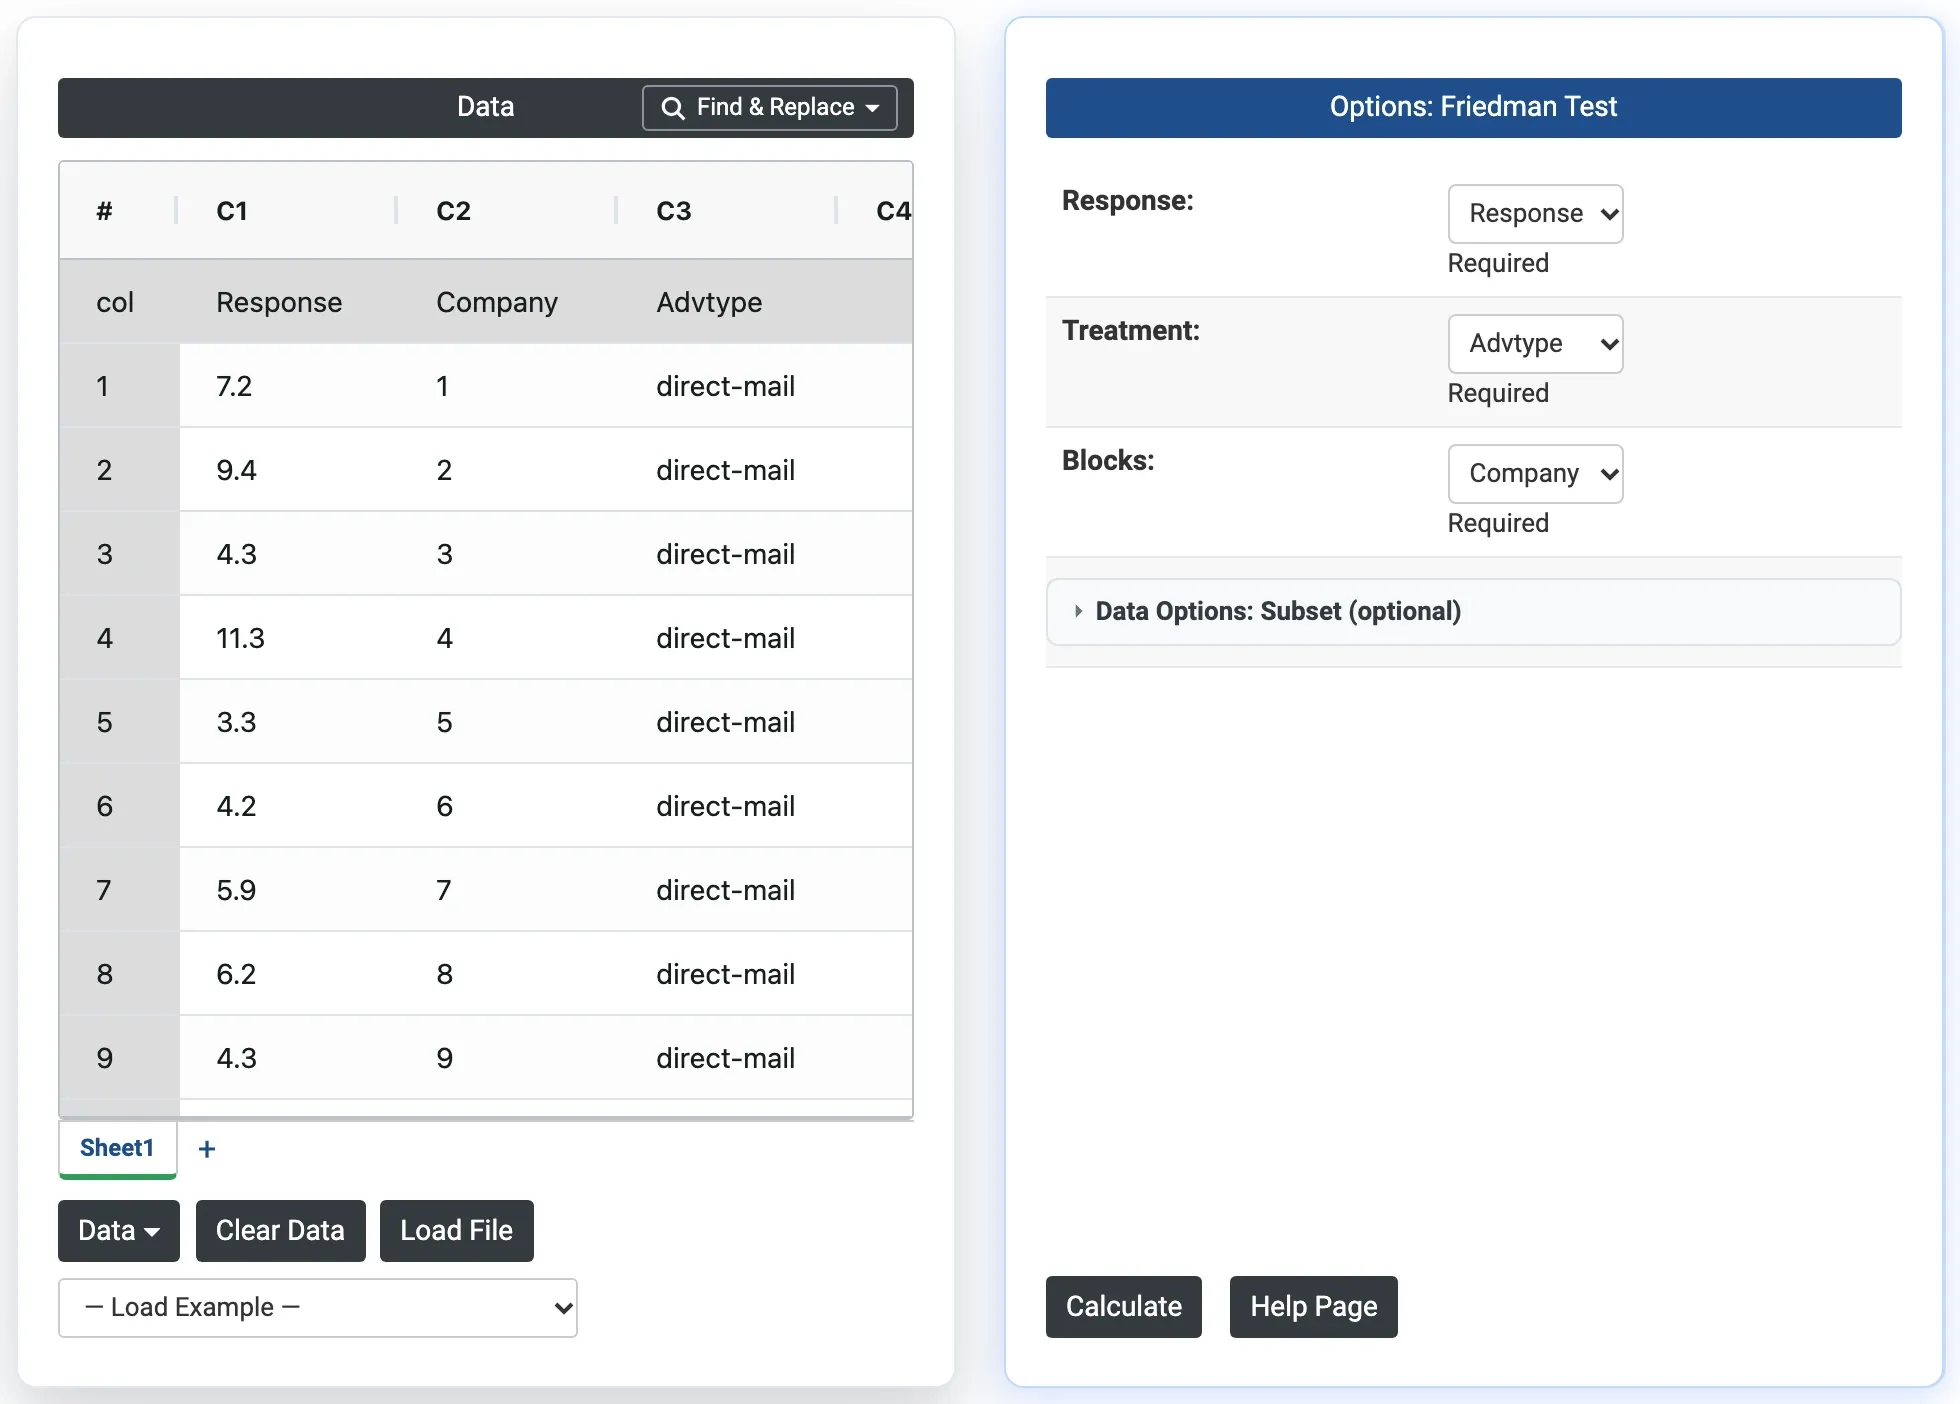
- In the Data grid, type the column names in the first (grey) row, then type or paste (Ctrl+V) your data below. Put the responses in one column, the treatment names in a second column and the block names in a third column, one observation per row. The — Load Example — list has "Set 4 — Stacked Groups", which has a Response and a Factor column but no blocks, so for this test use your own data or the tool page example.
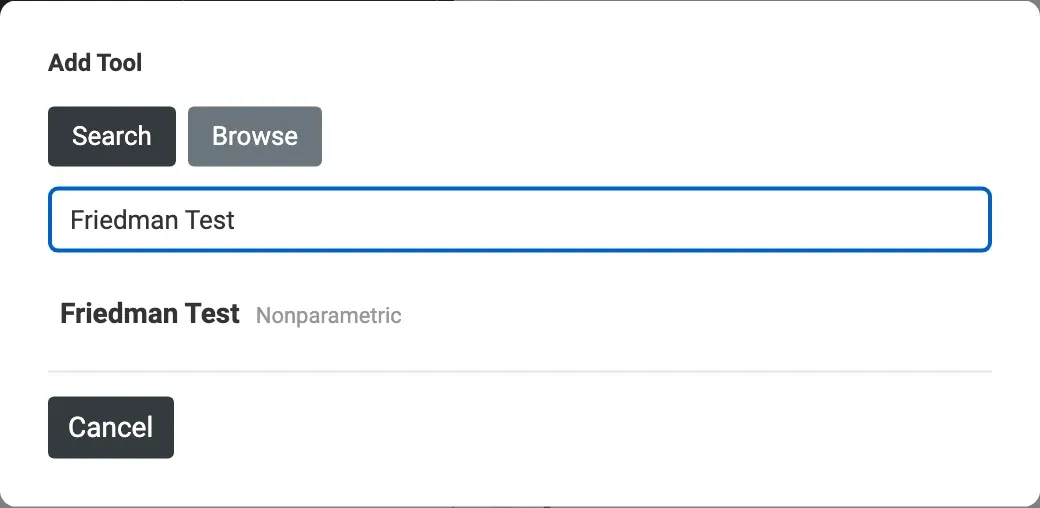
- Click + Add Tool, search for Friedman Test and open it. You can also find it under Browse › Nonparametrics.
- In Options: Friedman Test, choose your Response, Treatment and Blocks columns.
- Click Calculate. The results appear above the data.
- To keep them, use Download › (PDF, Word or Excel), or Export › to put several analyses into one file.
Only columns with a value in the first data row are sent to the tool, so don't leave the first cell of a column blank.
On the tool page
- Open Statistical Tools and click Friedman Test (category: Nonparametric).
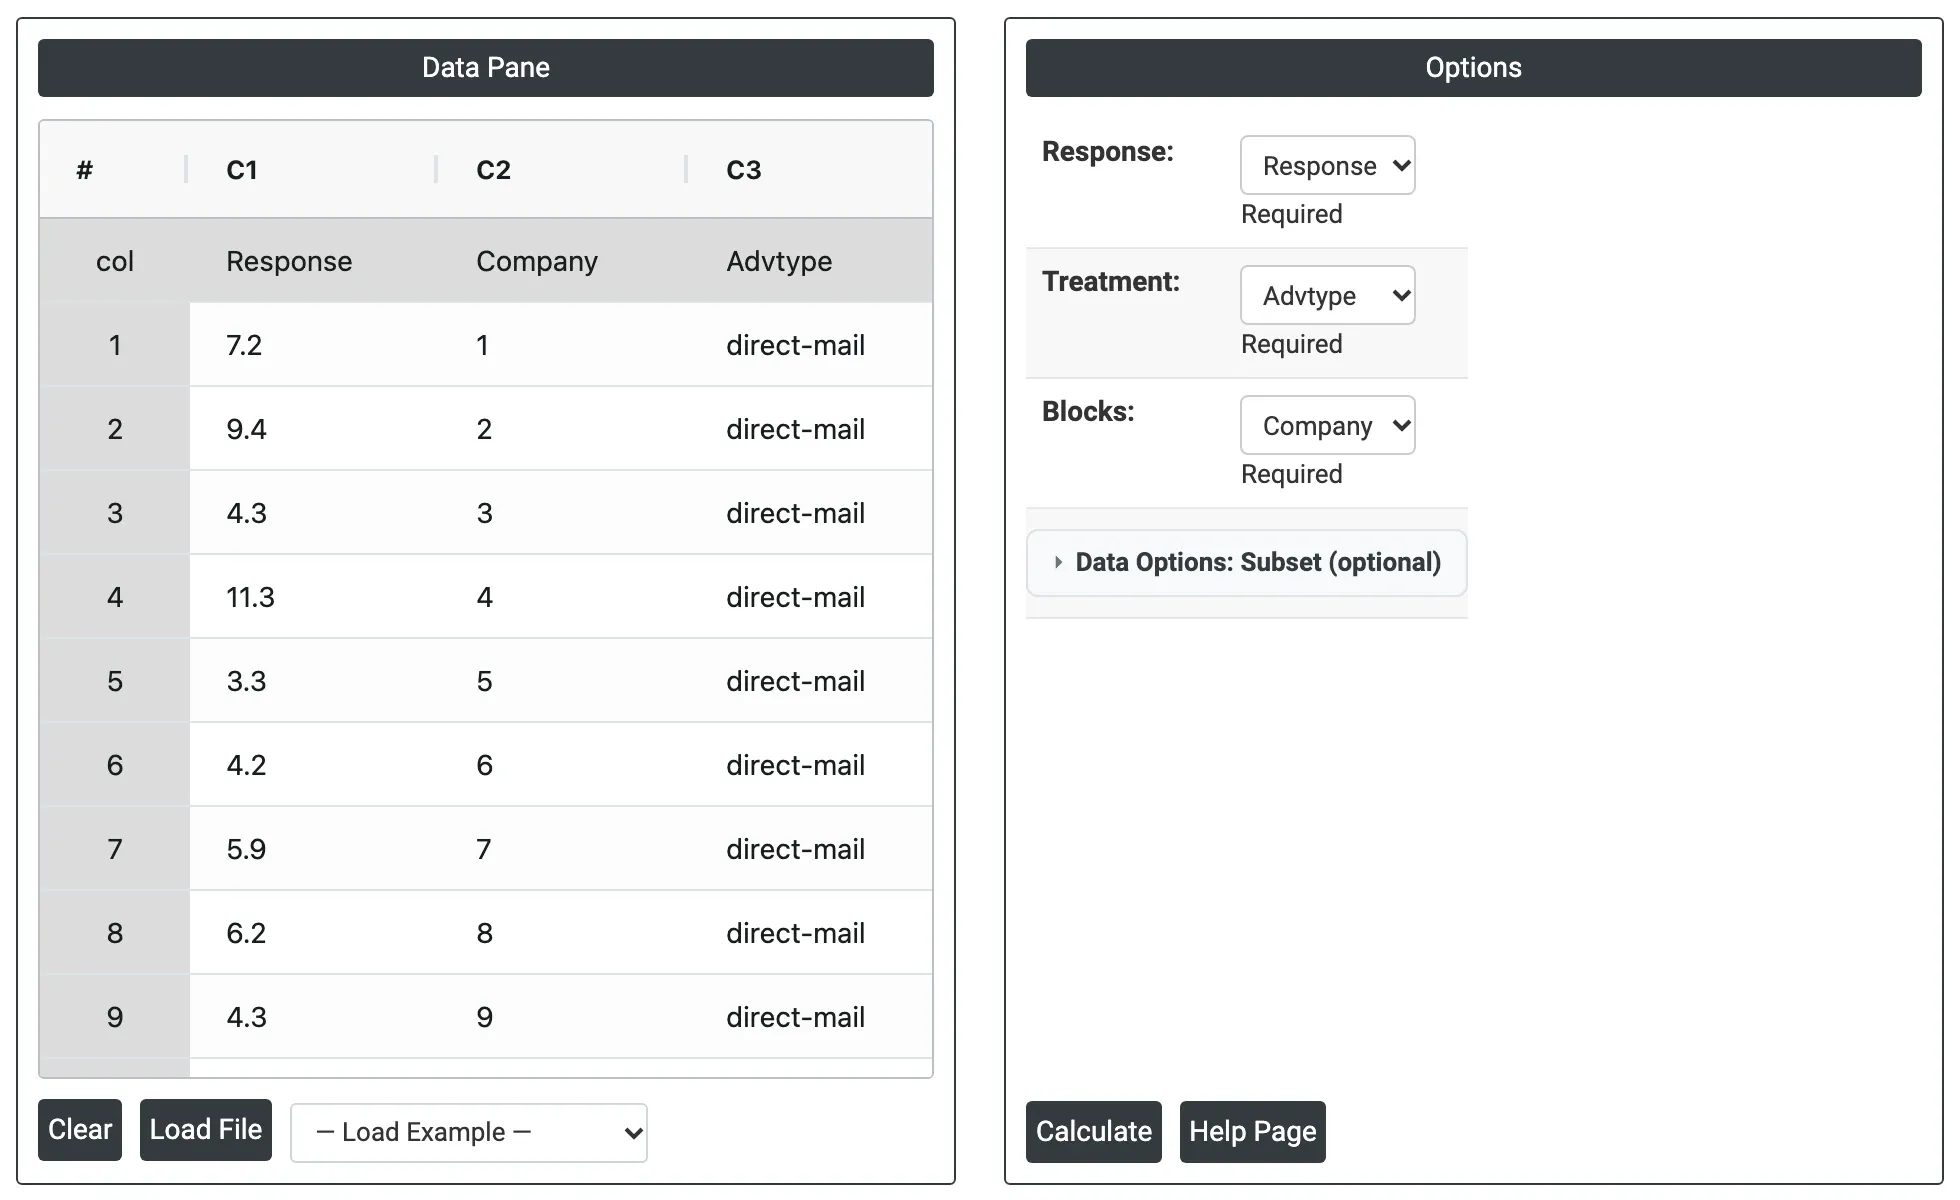
- Enter data in the Data Pane the same way, use Load File to open an Excel or CSV file, or pick advertising-effectiveness from — Load Example —, which also fills in the options.
- Set the Options and click Calculate.
- Use Download › to save the results as PDF, Word or Excel.
No account yet? Talk to us for a demo or a trial.
Options
Columns
- Response: the column with the measured values. Required. It must contain numeric data (continuous or ordinal).
- Treatment: the column that says which treatment each value belongs to. Required. The treatments are the groups you want to compare. There must be at least 2.
- Blocks: the column that says which block each value belongs to, such as the subject, batch, day or company. Required. There must be at least 2 blocks, and each block must have exactly one value for each treatment.
Use a different column for each of the three fields. If you pick the same column twice, the tool shows an error.
Data Options: Subset
- Data Options: Subset: Exclude matching rows (default) or Include only matching rows. It applies to the rows matched by Row numbers: or Condition:, and has no effect if both are empty. Leaving out part of a block makes the block incomplete, so subset by whole blocks or whole treatments.
- Row numbers: optional. Grid row numbers to match, using the original row numbers. Use commas for single rows and a hyphen for a range, for example
3,7,12-15. - Condition: optional. A rule such as
Company <= 6. Combine conditions withand,orandnot, put text values in quotes, and wrap column names that contain spaces in backticks. If both fields are filled in, a row matching either one is matched.
Output
The results show two parts, in this order.
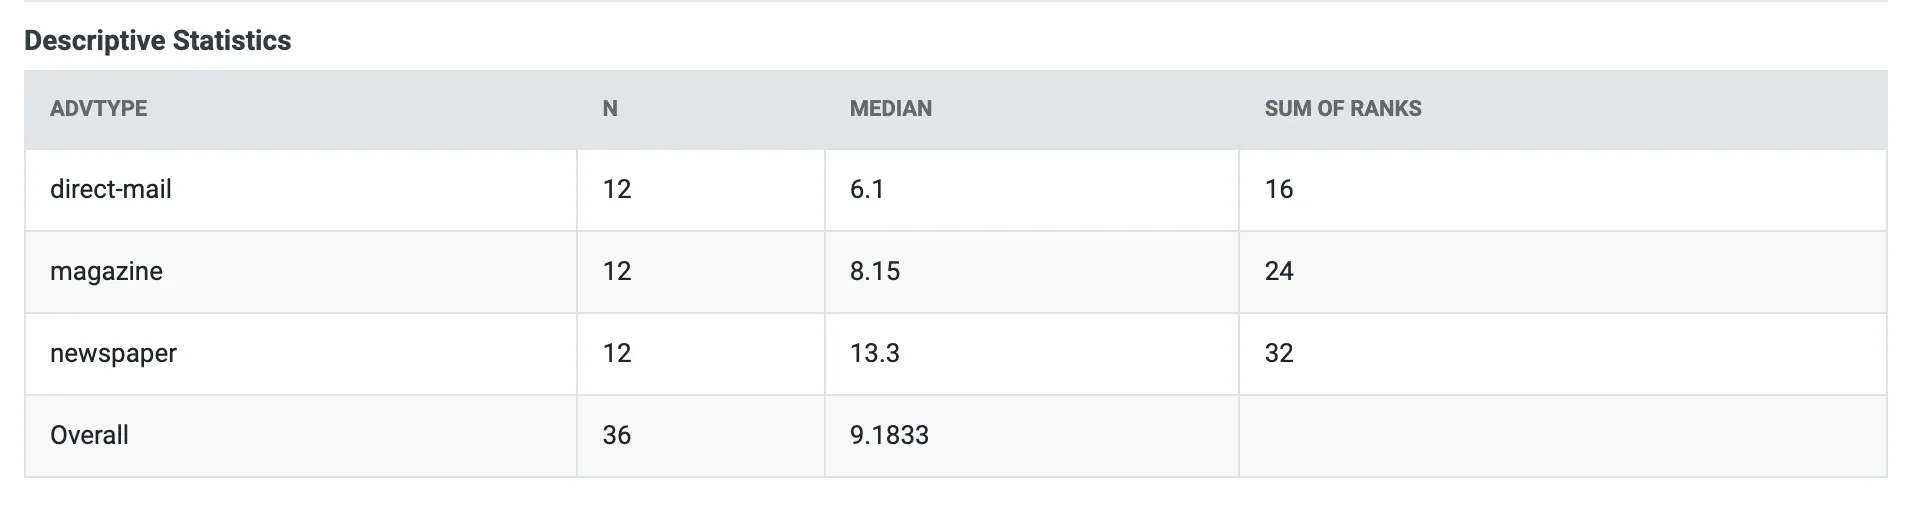
1. Descriptive Statistics. One row per treatment, then an Overall row.
- N: the number of observations for the treatment (one per block). The Overall row gives the total.
- Median: the estimated median of the treatment. It is built from the typical differences between treatments across the blocks, plus an overall median, so it can differ a little from the plain median of the raw values. The Overall row gives the overall median.
- Sum of Ranks: the total of the within-block ranks for the treatment. With 1 as the lowest rank in each block, a higher sum means the treatment tended to give higher responses.
2. Test. The null and alternative hypotheses, then a table with these columns.
- Method: "Not adjusted for ties" is always shown. "Adjusted for ties" is added only when some values tie within a block.
- DF: degrees of freedom, the number of treatments minus 1.
- Chi-Square: the Friedman statistic, shown to 2 decimals.
- P-Value: the probability of a chi-square value this large or larger if all treatment effects were zero, shown to 3 decimals.
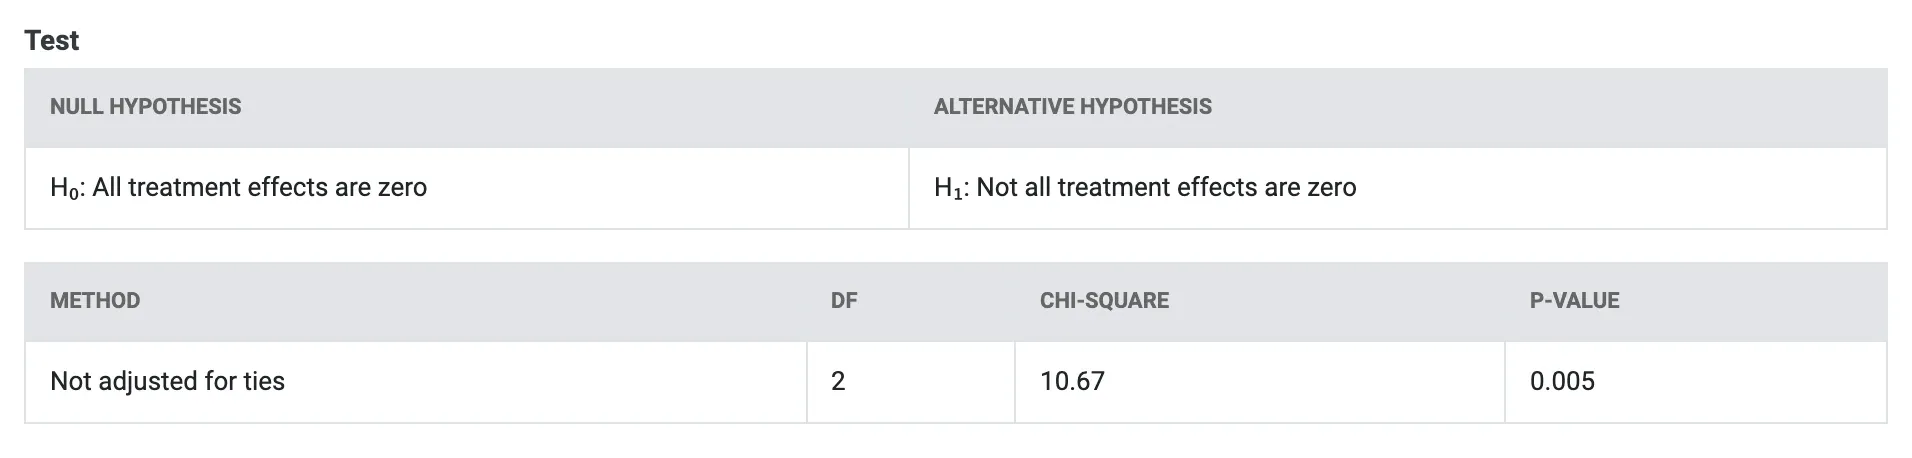
How to read it:
- If the P-Value is below your significance level (for example 0.05), at least one treatment differs from the others.
- If the P-Value is larger, you have no evidence that the treatments differ.
- When both rows are shown, use the adjusted row. It corrects for ties and is the more accurate of the two.
- The test says that treatments differ, not which ones. The tool does not run pairwise comparisons. Compare the Sum of Ranks and the Median to see which treatments are high or low. If you test pairs separately, adjust for the number of comparisons.
Worked example
This example uses the tool's own example, advertising-effectiveness. On the tool page, pick advertising-effectiveness from — Load Example — and click Calculate. It fills in Response = Response, Treatment = Advtype and Blocks = Company.
A marketing analyst wants to know whether the type of advertising affects client response rates. Twelve companies (the blocks) each tried three advertising types: direct mail, newspaper and magazine. The analyst recorded the percentage response for each. Every company provides three related values, so the Friedman test fits.
Descriptive Statistics
Advtype | N | Median | Sum of Ranks |
|---|---|---|---|
direct-mail | 12 | 6.1 | 16 |
magazine | 12 | 8.15 | 24 |
newspaper | 12 | 13.3 | 32 |
Overall | 36 | 9.1833 |
Test
Method | DF | Chi-Square | P-Value |
|---|---|---|---|
Not adjusted for ties | 2 | 10.67 | 0.005 |
How to read it:
- Each company ranks the three advertising types from 1 (lowest response) to 3 (highest). With 12 companies, the rank sum of a treatment can run from 12 to 36. Direct mail has 16, magazine 24 and newspaper 32. If the three types worked equally well, each would have a rank sum near 24.
- The chi-square statistic is 10.67 with 2 degrees of freedom, and the p-value is 0.005. It is below 0.05, so the advertising types do not all have the same effect.
- Newspaper ranks highest, with the largest rank sum (32) and median (13.3). Direct mail ranks lowest. Newspaper had the highest response in 9 of the 12 companies and direct mail in none.
- There are no ties within the companies, so there is no "Adjusted for ties" row.
- The test does not show which pairs differ. The data suggest newspaper differs most from direct mail, but confirm this with a follow-up comparison of that pair.
Frequently asked questions
What is the Friedman test?
It is a nonparametric test that compares three or more related treatments by ranking the values within each block. It tells you whether the treatments differ. It does not require normal data.
How do I arrange my data for the Friedman test in Zometric?
Use three stacked columns with one row per observation: one for the Response, one for the Treatment and one for the Blocks. Every block needs one row for every treatment. If your data have one column per treatment, stack them first with Data ▾ then Stack Columns… in the Statistical Workspace.
What is the difference between the Friedman test and the Kruskal-Wallis test?
The Friedman test is for related groups, where the same blocks are measured under every treatment. The Kruskal-Wallis Test is for independent groups, with no blocks.
The test is significant. How do I find out which treatments differ?
The tool does not give pairwise comparisons. Look at the Sum of Ranks and the Median to see which treatments are higher or lower. If you compare pairs with a separate test, adjust the significance level for the number of comparisons.
Why does the tool say a block is incomplete or has repeated treatments?
The Friedman test needs exactly one value for each treatment in every block. Fill in or remove the blocks that have a missing value, and remove or average repeated values for the same block and treatment.
Can I use the Friedman test with only two treatments?
The tool accepts 2 treatments, but a paired comparison is usually better: use the Paired T Test, or the One Sample Sign Test or One Sample Wilcoxon Test on the differences.