
Hotelling T² Chart (Multivariate)
The Hotelling T² chart tracks the Mahalanobis distance of each observation or subgroup from the joint process mean, using the covariance among two or more correlated variables. It works with individual observations or subgrouped data. The UCL comes from the F distribution with a default alpha of 0.0027, and only Rule 1 is checked. Output is the T² chart and a summary table with p, m, centre line and UCL.
Last reviewed
Key takeaway
A Hotelling T² chart monitors two or more correlated quality characteristics together, flagging observations whose joint distance from the process mean is unusual even when each variable looks in control alone.
On this page
Purpose
A Hotelling T² chart monitors two or more correlated quality characteristics TOGETHER, instead of watching each one on its own Individuals or Xbar chart. Two correlated variables can each look perfectly in-control on separate univariate charts while their relationship to each other has broken down — a Hotelling T² chart catches exactly that case by tracking the Mahalanobis distance of each observation (or subgroup) from the process's joint mean, using the process's own covariance structure.
Key Capabilities
- Supports both individual-observation data (one row per unit, no subgrouping) and subgrouped data via an optional Subgroup indicator column.
- Uses the full covariance structure among the selected variables, so it is sensitive to a break in the normal correlation between variables even when neither variable alone looks unusual.
- Configurable alpha (false-alarm rate), defaulting to the app-wide 0.0027 (3-sigma-equivalent) convention.
- Row inclusion/exclusion and a separate “estimate parameters from” selector to baseline the mean vector and covariance matrix on a known-stable period.
Statistical Methods
When no Subgroup indicator is selected (individual observations, one row per unit), the tool computes for each observation x_i the squared Mahalanobis distance from the estimated process mean vector x̄, using the sample covariance matrix S of the p selected variables across the m observations used to estimate parameters: T²_i = (x_i − x̄)′ S⁻¹ (x_i − x̄). The upper control limit follows the exact F-distribution-based formula for individual observations: UCL = [p(m−1)(m+1)] / [m(m−p)] · F(1−alpha; p, m−p), where alpha is the chosen false-alarm rate (default 0.0027). The center line displayed is p, the statistic's expectation under an in-control process.
When a Subgroup indicator is selected (n replicate rows per subgroup), the tool instead computes, for each subgroup j, T²_j = n·(x̄_j − x̄_grand)′ Sp⁻¹ (x̄_j − x̄_grand), where x̄_j is that subgroup's mean vector, x̄_grand is the grand mean across subgroup means, and Sp is the pooled within-subgroup covariance matrix (the average of the m individual within-subgroup sample covariance matrices). The control limit is UCL = [p(m−1)(n−1)] / (mn − m − p + 1) · F(1−alpha; p, mn − m − p + 1).
In both modes, T² is a one-sided, non-Normal statistic, so only Rule 1 (a point exceeding the UCL) is evaluated — the Western-Electric/Nelson zone rules built for Normally distributed control-chart statistics are not applied here, by design.
Input Fields & Options
Field | Description |
Variables | Required. Select 2 or more correlated variables measured on each observation. |
Subgroup indicator | Optional. Leave blank if each row is one individual observation. Select a column identifying the subgroup if several rows form one subgroup (n > 1 replicates). |
Alpha (false alarm rate) | Default 0.0027, matching the standard 3-sigma-equivalent false alarm rate used elsewhere in the app. |
X scale | Optional custom labeling for the observation axis. |
Include or Exclude / Specify which rows / Row numbers | Controls which rows are plotted. |
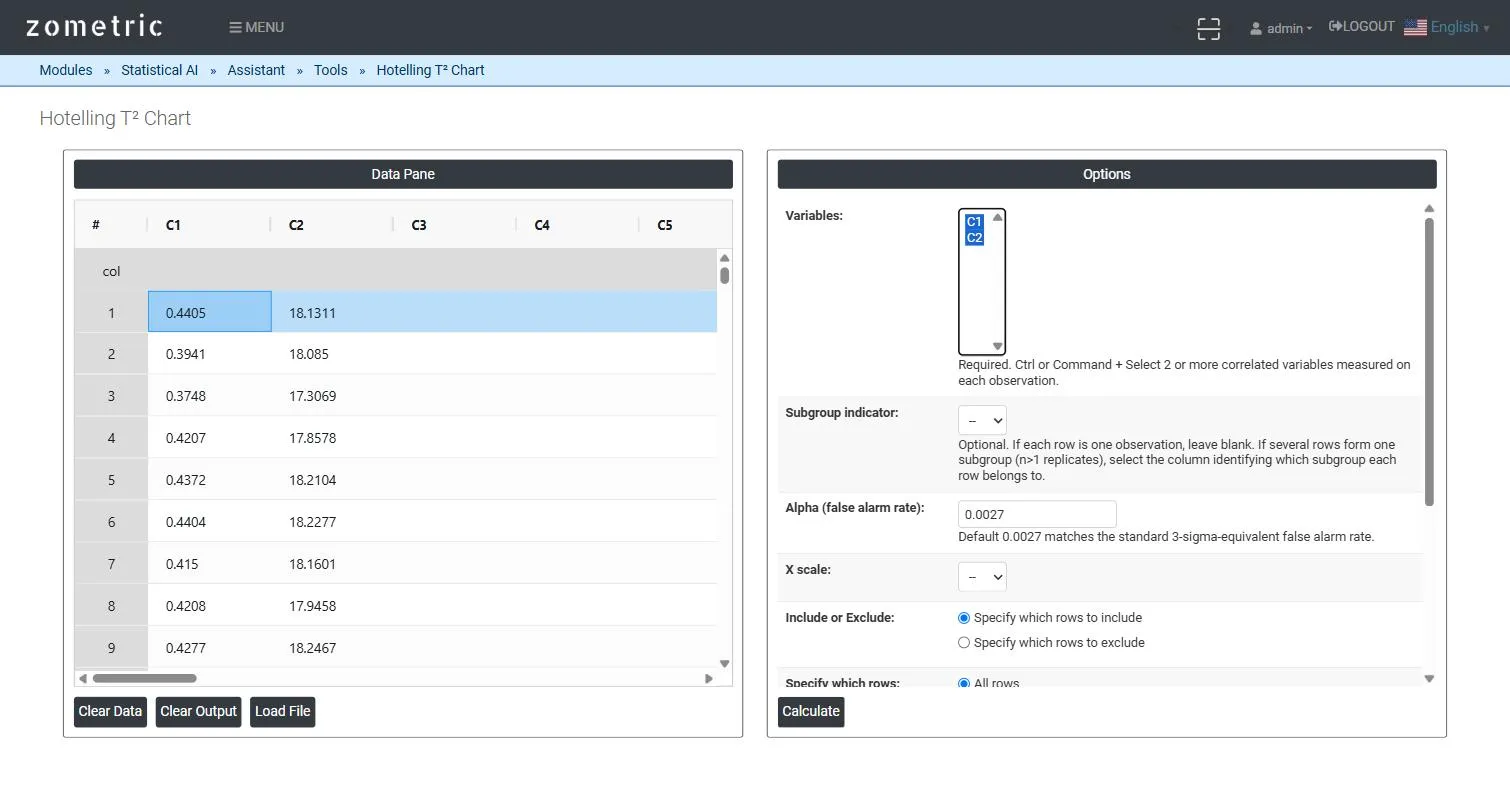
Figure 1 — 30 paired wall-thickness/weight readings pasted into C1–C2, both selected as Variables, Alpha at its 0.0027 default.
Output Descriptions
- T² Chart plot — the Hotelling T² statistic for each observation (or subgroup) in time order, with UCL and center line.
- Summary table — the variables used, p (number of variables), m (observations/subgroups used to estimate parameters), Alpha, the center line (E[T²]) and UCL.
- Nelson's Rules / Potential Special Cause Points — which points (if any) exceeded the control limit.
- PDF export via Download as PDF.
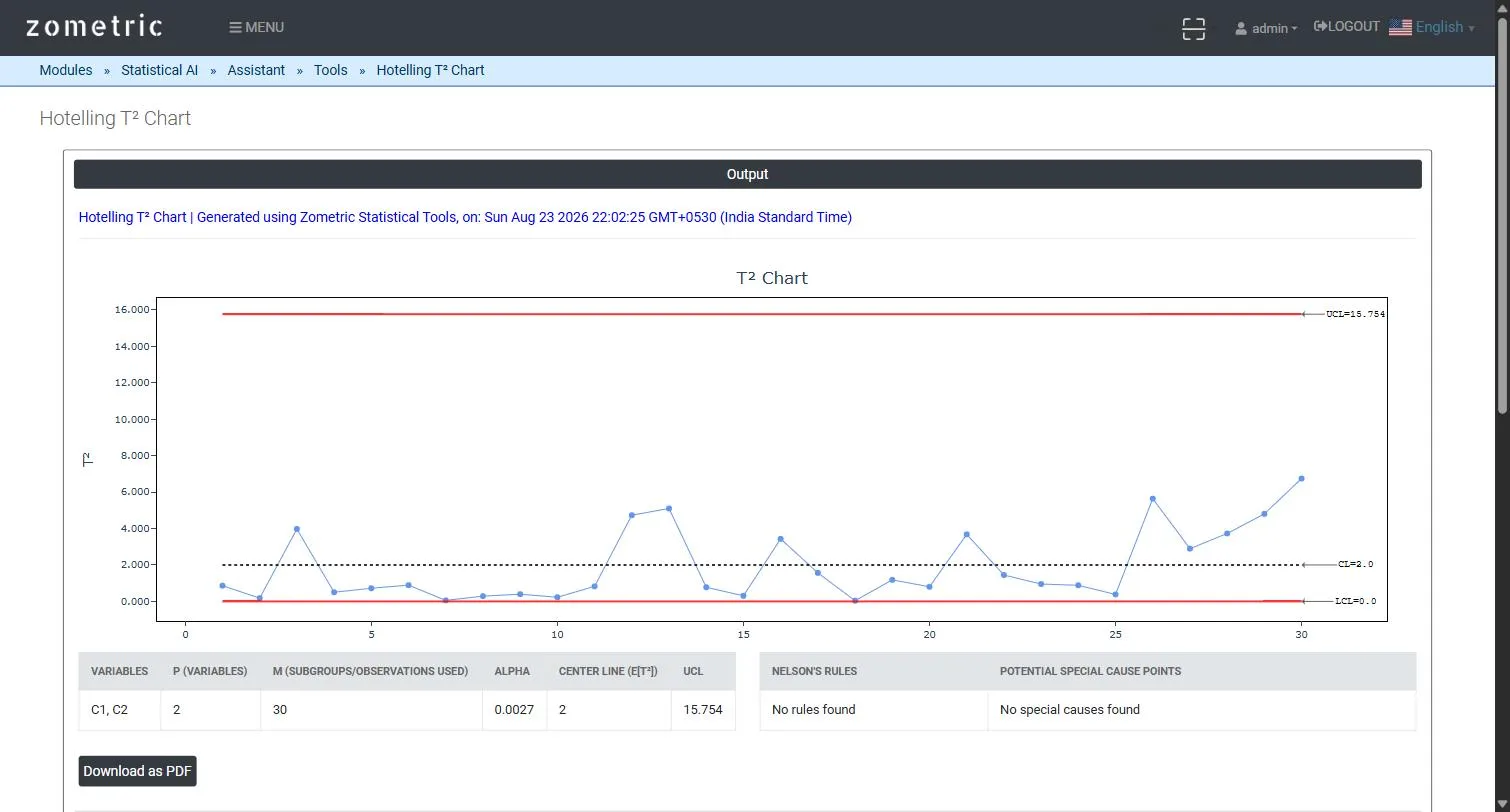
Figure 2 — T² Chart output: the plotted T² statistic per observation with UCL, and the Variables/p/m/Alpha/Center Line/UCL summary table.
Worked Example
A blow-molding process produces bottles where wall thickness (C1, mm) and weight (C2, g) are normally correlated — thinner walls mean lower weight. With both variables selected and Alpha at its 0.0027 default across 30 consecutive bottles, the tool computes UCL ≈ 15.75 for p = 2 variables and m = 30 observations; even though the last 5 bottles (where the normal thickness/weight relationship was deliberately broken in the demo dataset) don't individually breach the limit here, the T² series visibly trends upward exactly where the correlation structure was disturbed — the behavior a univariate chart on either variable alone would miss entirely.
Frequently asked questions
What is a Hotelling T² chart?
A Hotelling T² chart monitors two or more correlated quality characteristics together instead of on separate Individuals or Xbar charts. It plots the squared Mahalanobis distance of each observation or subgroup from the joint process mean, using the process's own covariance structure, so it catches a break in the normal relationship between variables.
Why use a Hotelling T² chart instead of separate univariate charts?
Two correlated variables can each look in control on separate univariate charts while their relationship to each other has broken down. In the blow-molding example, wall thickness and weight were normally correlated; when that relationship was broken for the last 5 bottles, the T² series trended upward, which a chart on either variable alone would miss.
How is the Hotelling T² control limit calculated?
The upper control limit comes from the F distribution and depends on the number of variables p, the number of observations or subgroups m, the subgroup size n when subgroups are used, and alpha, which defaults to 0.0027. For individual observations the centre line shown is p, the expected value of T² for an in-control process.
Why does the Hotelling T² chart only use Rule 1?
T² is a one-sided, non-normal statistic, so only Rule 1, a point exceeding the UCL, is evaluated. The Western Electric and Nelson zone rules were built for normally distributed control-chart statistics, so they are not applied to the T² chart by design.