
Interaction Plot
The Interaction Plot draws the mean response at each level of one factor, with a separate line per level of a second factor; three or more factors give a matrix of panels. It plots raw data means, so no model is fitted. Use it with designed experiments, General Linear Model or two-way ANOVA before choosing settings. Significance is tested with an ANOVA that includes the interaction term.
Last reviewed
Key takeaway
An interaction plot shows whether the effect of one factor on a response depends on the level of another factor: parallel lines mean no interaction, while converging or crossing lines mean the factors interact.
On this page
Purpose
The Interaction Plot shows whether the effect of one factor on a response depends on the level of another factor. It plots the mean response at each level of one factor, with a separate line for each level of the second factor. Parallel lines mean the factors act independently; lines that converge or cross mean they interact, and the best setting of one factor depends on the other. Use it with designed experiments, General Linear Model or two-way ANOVA, before deciding on settings.
Key Capabilities
- One plot per response; several responses can be selected at once.
- Two factors give a single panel: the first factor on the X axis, one line per level of the second.
- Three or more factors give a matrix of panels, one for each pair of factors.
- Full matrix option draws every pair both ways round, so each factor appears once on the X axis and once as the lines.
- Works on data means: no model is fitted, so it can be used on any data with categorical or numeric factor levels.
Statistical Methods
For each pair of factors (A on the X axis, B as lines), rows with a blank response or factor level are dropped and the response is averaged within every A × B combination. Each line joins the cell means ȳᵢⱼ for one level j of B across the levels i of A. Levels are sorted in their natural order (numbers numerically, text alphabetically). The plot title says “Data Means” because the points are raw cell means, not fitted values from a model.
Reading the plot: if the lines are parallel, the change in the mean from one level of A to the next is the same at every level of B, so there is no interaction. Non-parallel or crossing lines mean the effect of A changes with B. With unequal numbers of observations in the cells, or many cells, apparent differences can be noise; whether an interaction is statistically significant is tested with a two-way ANOVA or General Linear Model that includes the A×B term.
With two factors only the panel with the first factor on the X axis is drawn, unless the full matrix option is ticked. With three or more factors the panels form the upper triangle of a matrix (factor j on the X axis, factor i as lines, for j > i); the full matrix adds the lower triangle.
Input Fields & Options
Field | Description |
Responses | Required. One or more numeric response columns (Ctrl or Command + click for several). One plot is drawn per response. |
Factors | Required. At least 2 columns. Their order matters: with two factors the first is on the X axis and the second gives the lines. Three or more are drawn as a matrix. |
Display full interaction plot matrix | Off by default. Also draws each pair with the factors swapped. |
Data Options: Subset (optional) | Exclude matching rows (default) or Include only matching rows; Row numbers (e.g. 3,7,12-15) and/or a Condition (e.g. MetalType == 1) select the rows. |
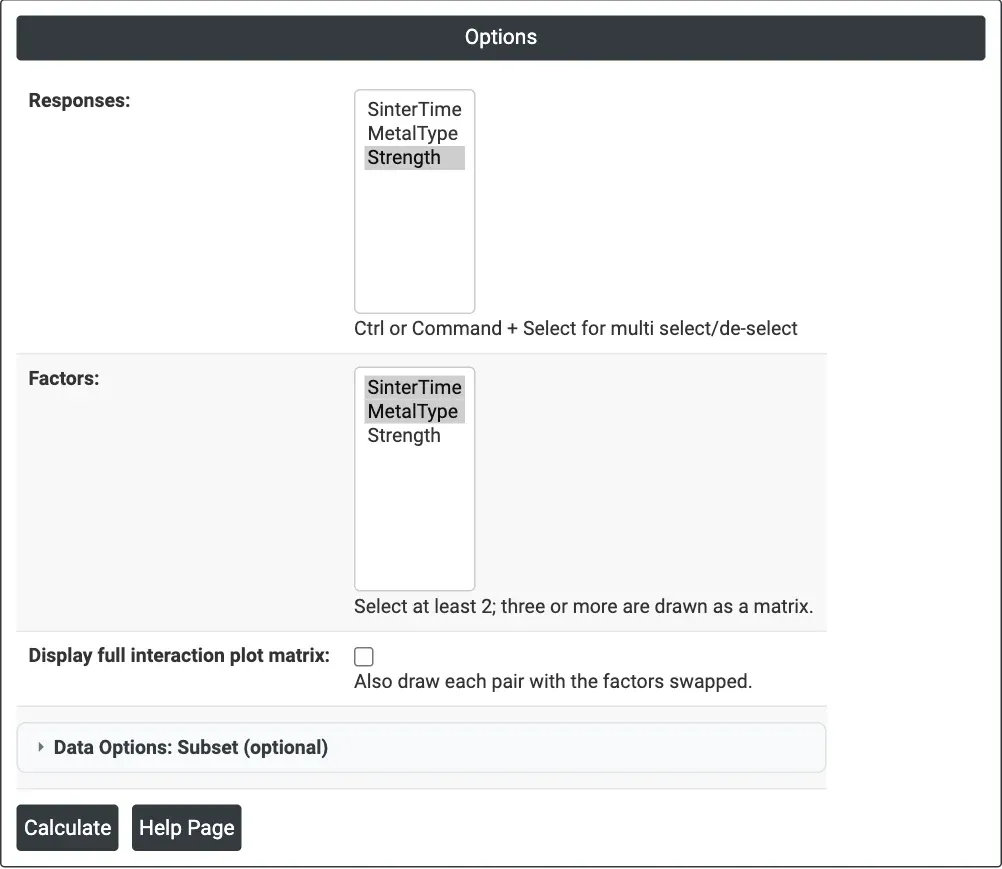
Figure 1 — Options for the example: Responses = Strength, Factors = SinterTime and MetalType.
Output Descriptions
- Interaction Plot for <response> (Data Means) — mean response against the levels of the X-axis factor, one coloured line per level of the other factor, with a legend; a matrix of such panels for three or more factors or with the full matrix ticked.
- PDF export via Download.
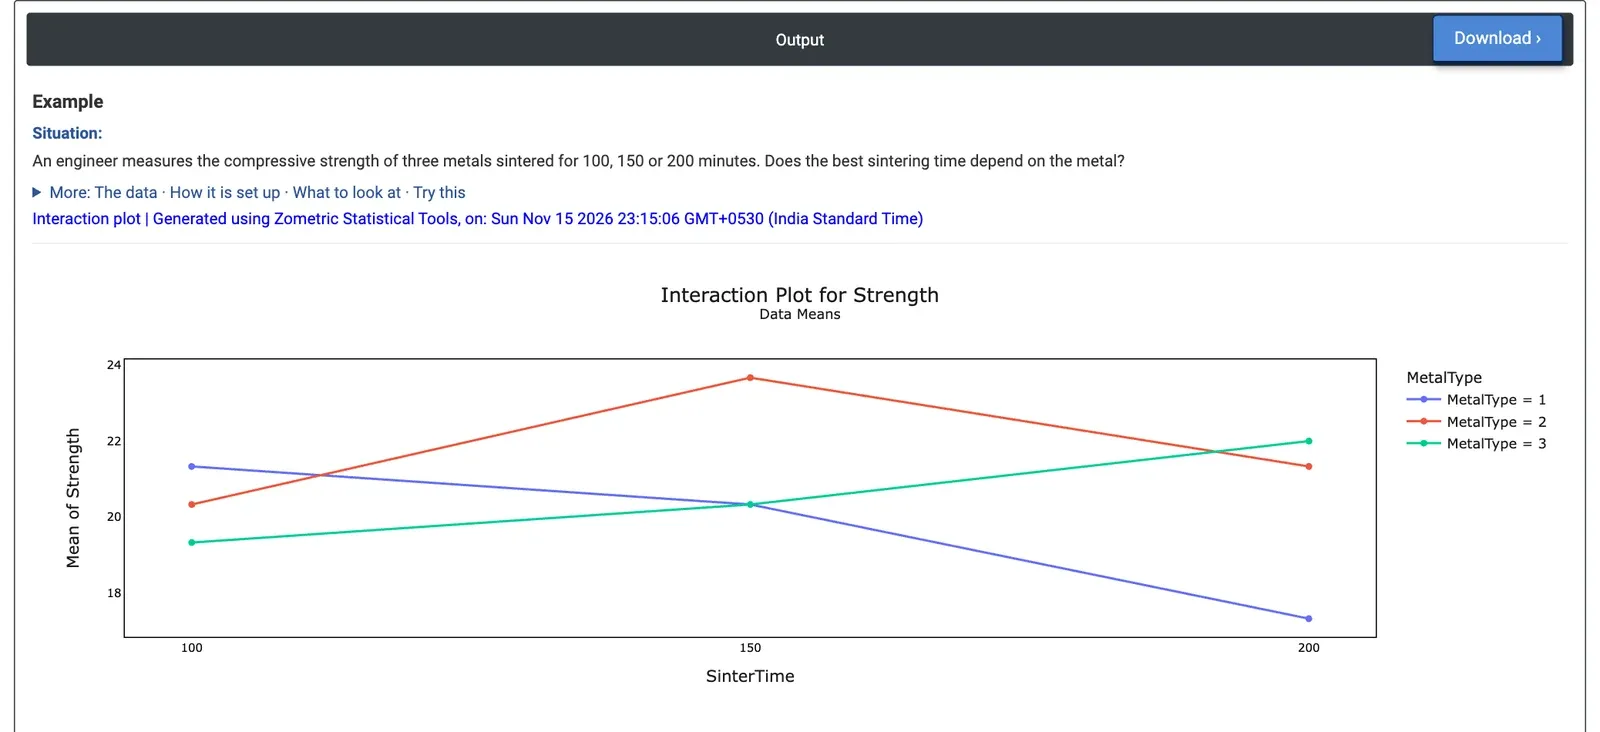
Figure 2 — Interaction Plot for Strength: mean strength against sintering time, one line per metal type. The lines cross.
Worked Example
An engineer measures the compressive strength of three metals (MetalType 1, 2 and 3) sintered for 100, 150 or 200 minutes, with three specimens per combination: 27 results. The question is whether one sintering time is best for all three metals. Responses = Strength and Factors = SinterTime, MetalType.
The lines cross, a clear interaction. Metal 1 gets weaker with longer sintering (mean 21.33, 20.33 and 17.33 at 100, 150 and 200 minutes). Metal 3 gets stronger (19.33, 20.33 and 22.00). Metal 2 peaks at 150 minutes with 23.67, the strongest combination overall. Averaged over the metals, the three times differ little (20.33, 21.44 and 20.22), so a main effects plot alone would suggest sintering time hardly matters; the interaction plot shows that it matters a great deal, but in opposite directions for different metals.
There is therefore no single best sintering time: the setting has to be chosen per metal (200 minutes for metal 3, 150 for metal 2, 100 for metal 1). A two-way ANOVA with the interaction term confirms it: SinterTime × MetalType has p = 0.008. Ticking Display full interaction plot matrix adds a second panel with metal type on the X axis and one line per sintering time, showing the same means the other way round.
Frequently asked questions
How do you read an interaction plot?
If the lines are parallel, the change in mean from one level of the X-axis factor to the next is the same at every level of the other factor, so there is no interaction. Non-parallel or crossing lines mean the effect of one factor changes with the other, so the best setting of one factor depends on the level of the other.
What is the difference between an interaction plot and a main effects plot?
A main effects plot averages over the other factors, so it can hide effects that run in opposite directions. In the sintering example, the three times differed little on average, suggesting time hardly mattered, but the interaction plot showed it mattered a great deal: metal 1 weakened, metal 3 strengthened and metal 2 peaked at 150 minutes.
Does an interaction plot test whether an interaction is significant?
No. The plot shows raw cell means, not fitted values, and with unequal cell sizes or many cells apparent differences can be noise. Whether an interaction is statistically significant is tested with a two-way ANOVA or General Linear Model that includes the interaction term; in the example, that test gave p = 0.008.
How does the interaction plot handle three or more factors?
With three or more factors, the plot shows a matrix of panels, one for each pair of factors. With two factors, only the panel with the first factor on the X axis is drawn unless Display full interaction plot matrix is ticked, which also draws each pair with the factors swapped.