
MEWMA Chart (Multivariate EWMA)
The MEWMA chart monitors two or more correlated variables at once by smoothing them jointly with a weight lambda (default 0.1). Use it to catch small, sustained multivariate drifts that a Hotelling T² chart reacts to more slowly. The baseline mean vector and covariance can come from a stable period. It plots a smoothed T² statistic against a chi-square UCL with alpha 0.0027.
Last reviewed
Key takeaway
A MEWMA chart is a multivariate EWMA control chart that smooths two or more correlated variables together, making it more sensitive than a Hotelling T² chart to small, sustained shifts in the joint process.
On this page
Purpose
A MEWMA (Multivariate Exponentially Weighted Moving Average) chart is the multivariate counterpart to the app's univariate EWMA chart, and the small-sustained-shift counterpart to the Hotelling T² chart: where a T² chart reacts to each new observation independently, a MEWMA chart smooths several correlated variables together across observations, making it substantially more sensitive to a small but sustained drift in the joint process (e.g. a slowly fouling catalyst affecting two related quality measurements together) than an unsmoothed T² chart would be.
Key Capabilities
- Smooths two or more correlated variables jointly using a single, tunable weighting constant (lambda).
- Detects small, sustained multivariate shifts substantially faster than the unsmoothed Hotelling T² chart, at the cost of slightly slower reaction to a single large, isolated shift.
- Configurable alpha (false-alarm rate), defaulting to the app-wide 0.0027 convention.
- Row inclusion/exclusion and a separate “estimate observations to estimate parameters” selector to baseline the mean vector and covariance matrix on a known-stable period.
Statistical Methods
Let x_i be the vector of the selected variables at observation i, and x̄ the estimated in-control mean vector (estimated from all rows, or from a specified baseline subset). The MEWMA smoothing vector is updated recursively over every observation in order: Z_i = λ·(x_i − x̄) + (1 − λ)·Z_{i−1}, with Z_0 = 0, where λ (the Weight field) is the smoothing constant, 0 < λ ≤ 1. Smaller λ values (e.g. the default 0.1) weight more historical observations into each smoothed point, making the chart more sensitive to small sustained shifts; larger λ values weight recent observations more heavily and cause the chart to behave increasingly like an unsmoothed Hotelling T² chart.
Because the smoothing vector's own covariance shrinks as more observations accumulate, its exact time-varying covariance is used rather than a fixed one: Σ_Zi = [λ/(2−λ)]·[1 − (1−λ)^(2i)]·Σ, where Σ is the sample covariance matrix of the variables (the standard closed-form result for MEWMA, Lowry, Woodall, Champ & Rigdon, 1992). The plotted statistic is then T²_i = Z_i′ Σ_Zi⁻¹ Z_i.
The upper control limit uses the standard chi-square approximation, the conventional practical choice in the absence of ARL-optimized simulated tables: UCL = chi2.ppf(1 − alpha, p), with the default alpha = 0.0027. As with the Hotelling T² chart, only Rule 1 (a point exceeding the UCL) is evaluated, since this is a one-sided, non-Normal distance statistic.
Input Fields & Options
Field | Description |
Variables | Required. Select 2 or more correlated variables measured on each observation. |
Weight (lambda) | Smoothing constant, 0 < lambda ≤ 1. Default 0.1. Smaller values detect small sustained shifts faster; larger values react more like an unsmoothed T² chart. |
Alpha (false alarm rate) | Default 0.0027, matching the standard 3-sigma-equivalent false alarm rate. |
X scale | Optional custom labeling for the observation axis. |
Include or Exclude / Specify which rows / Row numbers | Controls which rows are plotted. |
Specify observations to estimate parameters (mean vector & covariance matrix) / Observations | Optionally restricts which rows are used to estimate the baseline mean vector and covariance matrix, while still plotting all rows. |
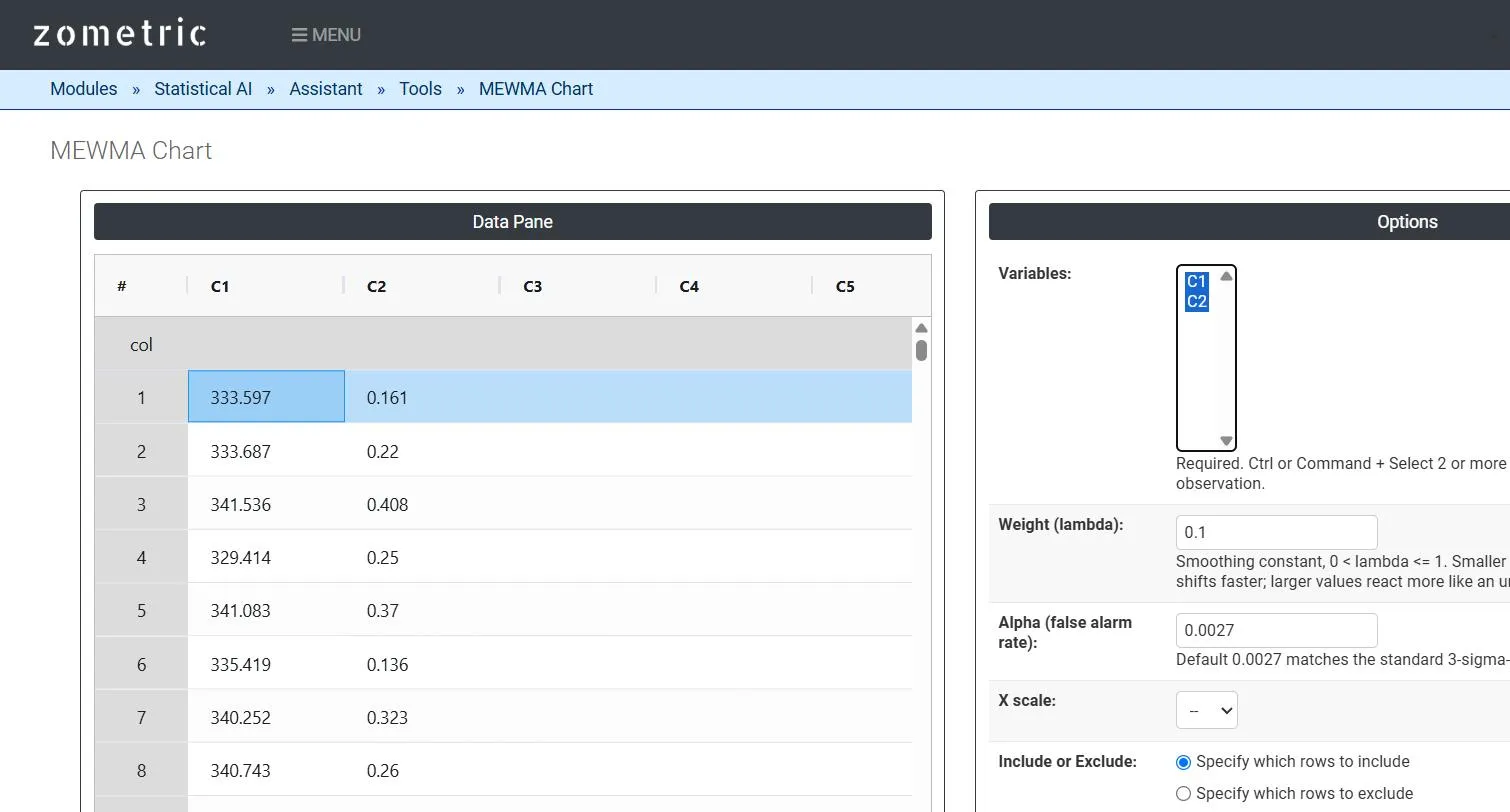
Figure 1 — 25 paired viscosity/monomer-% batch readings pasted into C1–C2, both selected as Variables, Weight (lambda) = 0.1.
Output Descriptions
- MEWMA Chart plot — the smoothed MEWMA T² statistic for each observation in time order, with UCL and (near-zero) LCL.
- Summary table — the variables used, p (number of variables), m (observations used to estimate parameters), Weight (lambda), Alpha and UCL.
- Nelson's Rules / Potential Special Cause Points — which points (if any) exceeded the control limit.
- PDF export via Download as PDF.
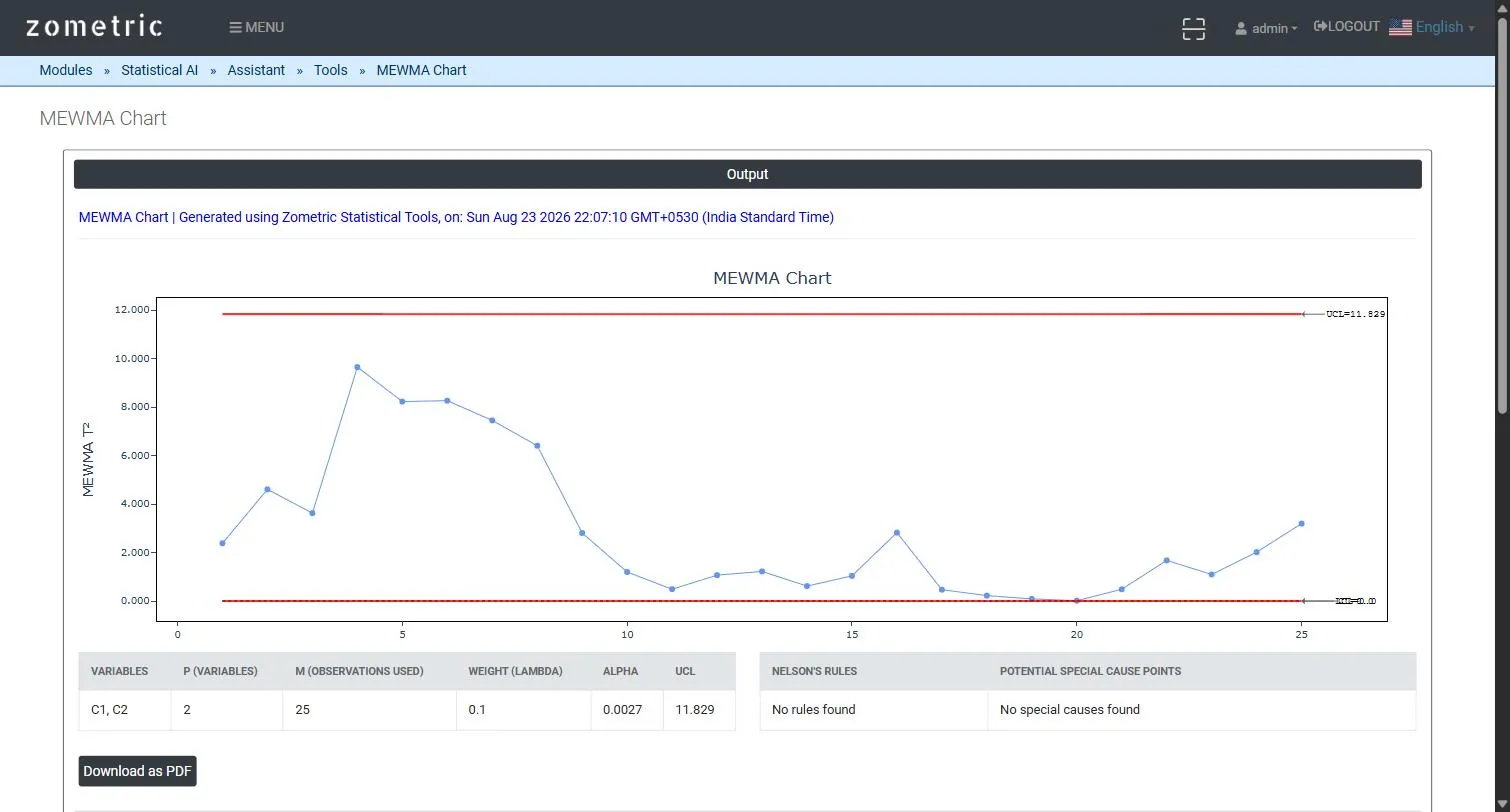
Figure 2 — MEWMA Chart output: the smoothed MEWMA T² statistic per batch with UCL, and the Variables/p/m/Weight/Alpha/UCL summary table.
Worked Example
A batch reactor's product quality depends jointly on final viscosity (C1, cP) and residual monomer % (C2), which drift together as a catalyst slowly fouls across 25 consecutive batches. With Weight (lambda) = 0.1 and Alpha = 0.0027, the smoothed MEWMA T² statistic climbs steadily from batch 1 through roughly batch 4–5 (reaching ≈ 9.7 against a UCL of ≈ 11.8) as the built-in slow drift accumulates in the smoothed statistic, then relaxes back down — exactly the kind of small, sustained, jointly-correlated shift a MEWMA chart is built to surface earlier than an unsmoothed T² chart would.
Frequently asked questions
What is a MEWMA chart?
A MEWMA (Multivariate Exponentially Weighted Moving Average) chart is the multivariate counterpart to the EWMA chart. It smooths two or more correlated variables jointly across observations and plots a T² statistic of the smoothed vector, which makes it more sensitive to a small but sustained drift in the joint process than an unsmoothed Hotelling T² chart.
When should you use a MEWMA chart instead of a Hotelling T² chart?
Use a MEWMA chart when the concern is a small, sustained shift affecting several correlated variables together, such as a slowly fouling catalyst changing two quality measurements. The MEWMA chart detects such shifts substantially faster than the Hotelling T² chart, at the cost of slightly slower reaction to a single large, isolated shift.
How do you choose the lambda weight for a MEWMA chart?
Lambda is the smoothing constant, with 0 < lambda <= 1 and a default of 0.1. Smaller values weight more historical observations into each smoothed point, making the chart more sensitive to small sustained shifts. Larger values weight recent observations more heavily, so the chart behaves increasingly like an unsmoothed Hotelling T² chart.
How is the upper control limit of a MEWMA chart calculated?
The upper control limit uses the chi-square approximation: UCL = chi2.ppf(1 - alpha, p), where p is the number of variables and alpha defaults to 0.0027, the 3-sigma-equivalent false alarm rate. Only Rule 1, a point exceeding the UCL, is evaluated, because the plotted statistic is a one-sided, non-Normal distance measure.