
1-Sample Equivalence Test
The 1-Sample Equivalence Test checks whether a mean is close enough to a target, within limits set in advance, such as potency within plus or minus 5% of label claim. It runs two one-sided t-tests; equivalence is claimed when both p-values are below alpha. It assumes independent, roughly normal data. Output includes descriptive statistics, the equivalence confidence interval, the test table and an equivalence plot.
Last reviewed
Key takeaway
The 1-Sample Equivalence Test uses two one-sided t-tests (TOST) to show whether a sample mean is within preset limits of a target, giving positive evidence that the difference is too small to matter.
On this page
Purpose
The 1-Sample Equivalence Test shows whether the mean of a sample is close enough to a target, within limits you set in advance. A 1-sample t-test can only say whether the mean differs from the target; a non-significant t-test does not prove that it is on target. The equivalence test turns the question round: the null hypothesis is that the mean is outside the limits, so a significant result is positive evidence that the difference is too small to matter. Use it for questions such as whether a batch's mean potency is within ±5% of the label claim, or whether a process mean is within an agreed band around nominal.
Key Capabilities
- Two one-sided tests (TOST) for Lower limit < test mean − target < upper limit, with the confidence interval for equivalence.
- One-sided alternatives: difference above the lower limit, difference below the upper limit, or test mean above or below the target.
- Limits in the units of the data, or as fractions of the target (Multiply by target).
- Choice between the interval that includes the midpoint of the limits and the plain 100(1 − 2α)% interval.
- Plain-language conclusion under the interval and test tables.
- Equivalence plot, histogram, boxplot (with an outlier list) and individual value plot.
Statistical Methods
From the n values the tool computes the mean x̄, the standard deviation s and the standard error SE = s / √n. The difference is D = x̄ − target. For the default alternative, two one-sided t-tests are run with n − 1 degrees of freedom: t₁ = (D − lower limit) / SE tests the null hypothesis D ≤ lower limit (p-value from the upper tail), and t₂ = (D − upper limit) / SE tests D ≥ upper limit (p-value from the lower tail). Equivalence is claimed when both p-values are below α, which is the same as the greater of the two being below α.
The confidence interval for equivalence starts from D ± t(1 − α; n − 1)·SE and is stretched, if needed, to include the midpoint of the two limits (zero for symmetric limits); its level is 100(1 − α)%, as in Minitab. Equivalence is claimed when this interval lies inside the equivalence interval. With Use 100(1 − 2α)% CI ticked, the plain interval D ± t(1 − α; n − 1)·SE is shown instead, labelled as a 100(1 − 2α)% interval. The one-sided alternatives use one t-test and a one-sided confidence bound: test mean − target > lower limit, test mean − target < upper limit, or, for Test mean > target and Test mean < target, a bound of zero (a superiority or inferiority test). With Multiply by target, the limits entered are multiplied by the target, so 0.05 means 5% of the target.
The test assumes independent values from a roughly normal population; with 20 or more values, moderate skewness has little effect. Choose the limits from engineering or regulatory needs before looking at the data. Equivalence is about the mean: it does not say that every unit is inside the limits.
Input Fields & Options
Field | Description |
Sample | Required. Numeric column with the measurements; blank cells are ignored. |
Target | The value the sample mean is compared against, e.g. a nominal or label claim. Default 0. |
Alpha | Significance level, default 0.05. |
Alternative hypothesis | Lower limit < test mean − target < upper limit (default, equivalence), test mean − target > lower limit, test mean − target < upper limit, Test mean > target, or Test mean < target. |
Lower Limit / Upper Limit | Required. The equivalence limits for test mean − target; the lower limit must be below the upper limit. |
Boxplot of Sample / Histogram of Sample / Equivalence plot / Individual value plot | Graphs to draw. Only Equivalence plot is ticked by default. The boxplot also adds a list of outliers beyond 1.5 × IQR. |
Multiply by target | Off by default. The limits are fractions of the target, e.g. −0.05 and 0.05 for ±5%. |
Use 100(1 − 2α)% CI | Off by default. Shows the plain 100(1 − 2α)% interval instead of the one that includes the midpoint of the limits. |
Data Options: Subset (optional) | Exclude matching rows (default) or Include only matching rows, by row numbers (e.g. 3,7,12-15) and/or a condition. |
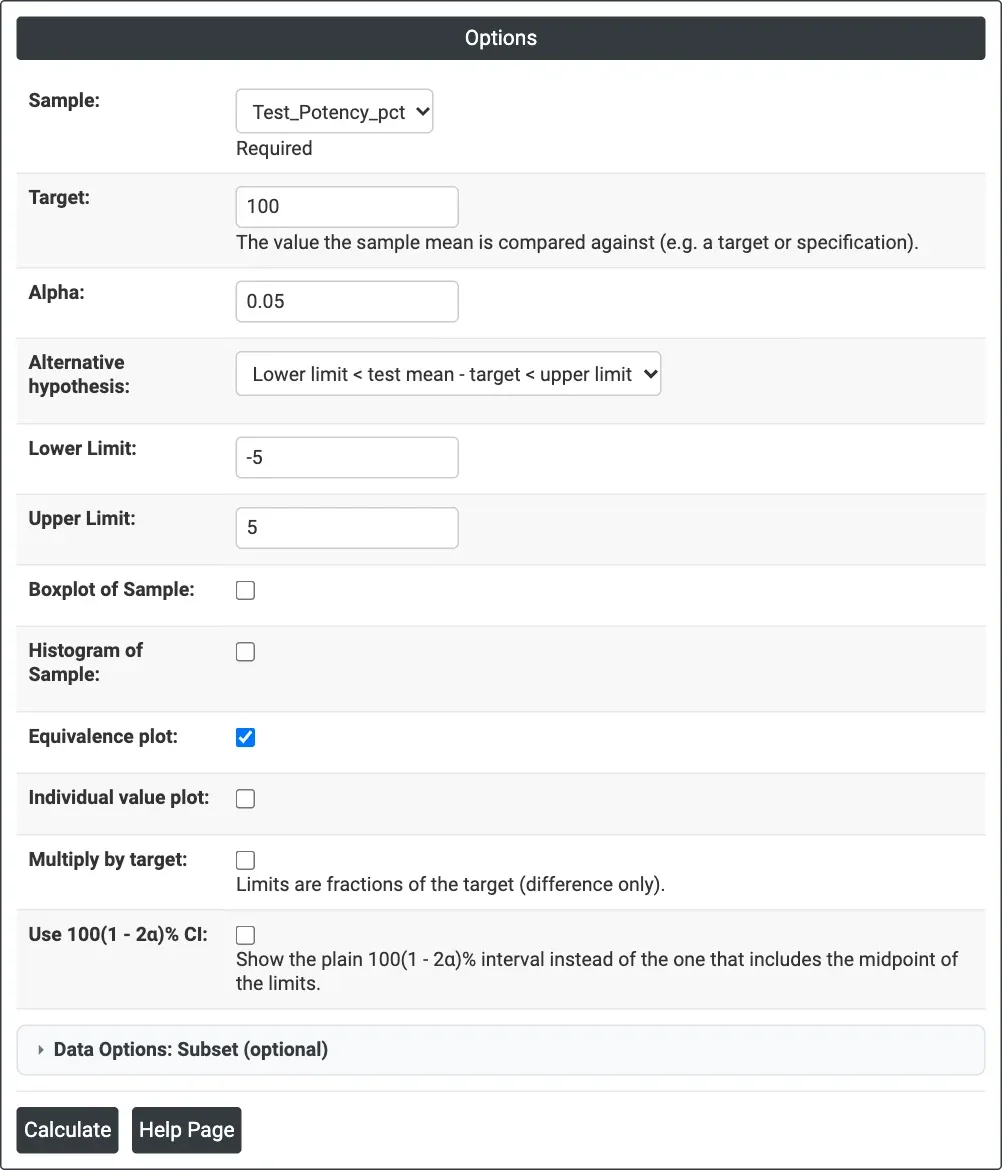
Figure 1 — Options for the example: Test_Potency_pct against a target of 100 with equivalence limits −5 and 5.
Output Descriptions
- Method — the difference tested: Sample mean − Reference value (target).
- Descriptive statistics — N, Mean, StDev and SE Mean.
- Difference table — Difference, StDev, SE, the 95% CI for Equivalence and the Equivalence Interval, with a note saying whether the CI is within the equivalence interval.
- Hypotheses — the null and alternative hypotheses and the significance level.
- Test table — DF, T-Value and P-Value for each one-sided test, with a note giving the greater p-value and whether equivalence can be claimed.
- Equivalence Test: Mean − <target> — the confidence interval against the lower (LEL) and upper (UEL) equivalence limits.
- Histogram of Sample, Boxplot of Sample and Individual Value Plot of Sample, when ticked.
- PDF export via Download.
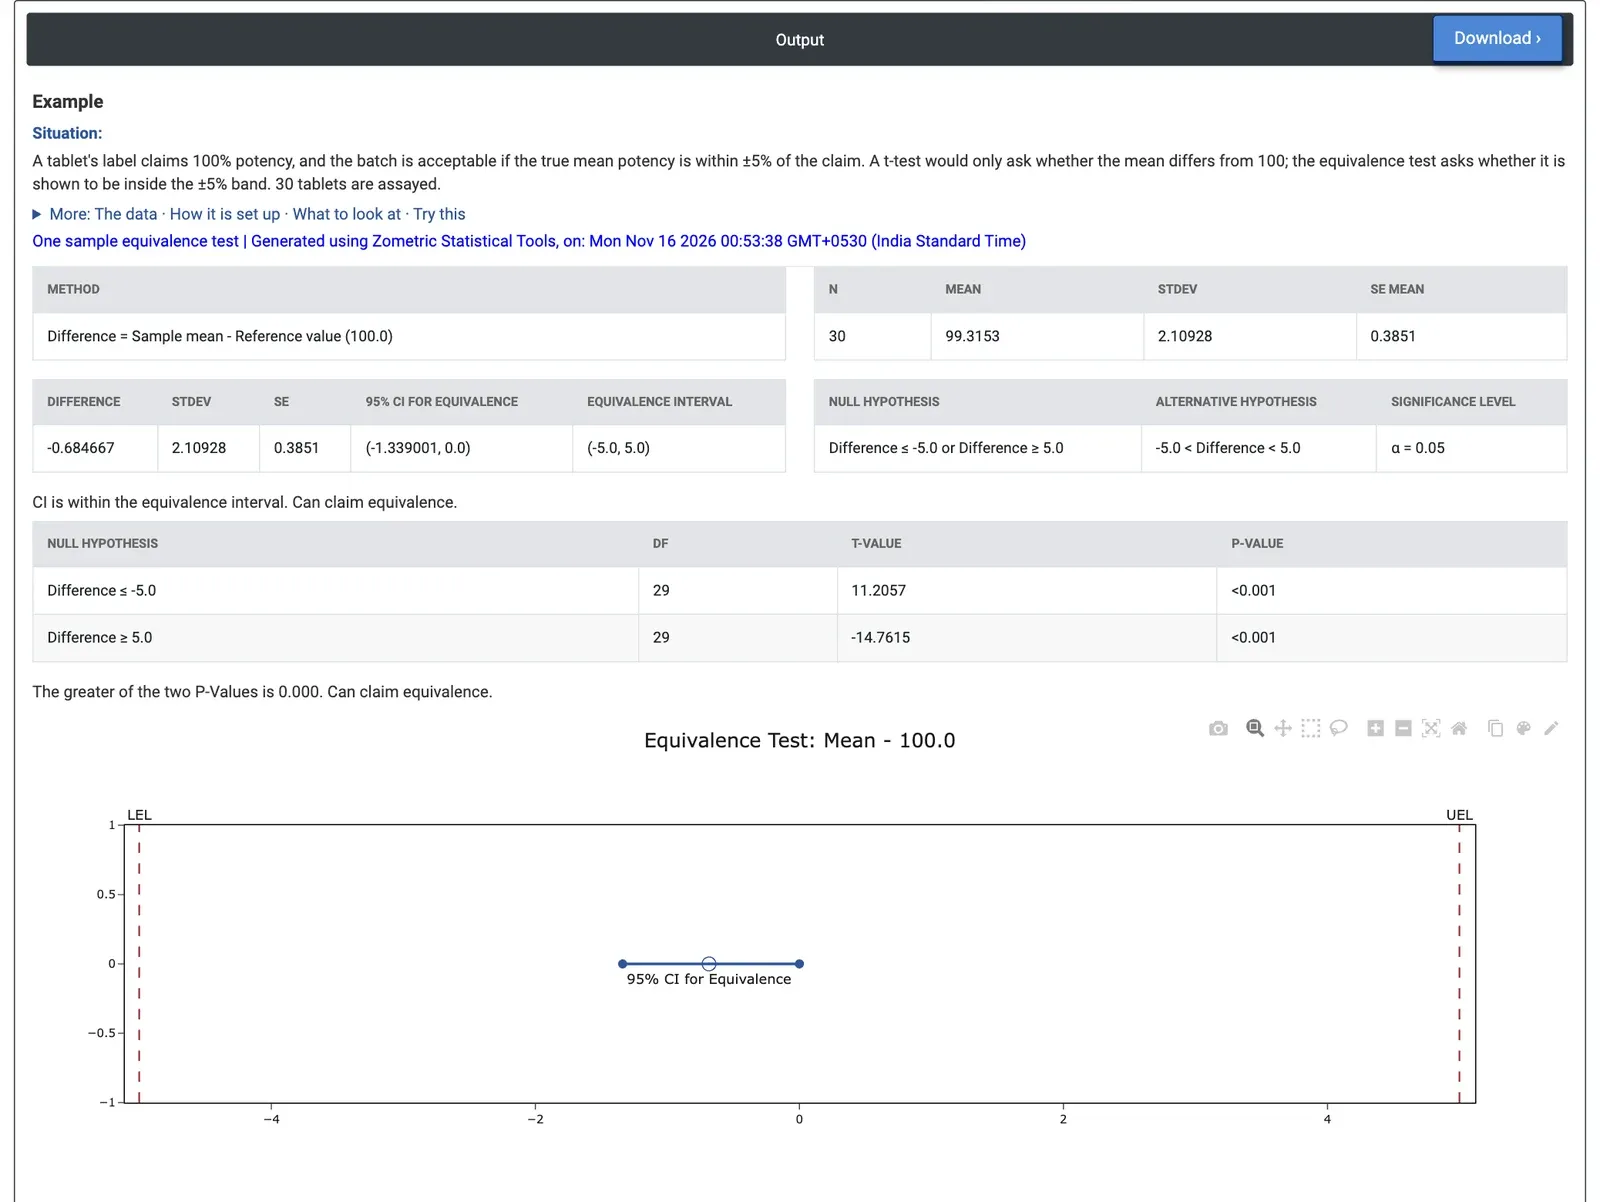
Figure 2 — The 95% CI for equivalence, −1.339 to 0, lies well inside the limits −5 to 5, and both one-sided tests give p < 0.001.
Worked Example
A tablet's label claims 100% potency, and a batch is acceptable if the true mean potency is within ±5% of the claim. The quality laboratory assays 30 tablets. Sample = Test_Potency_pct, Target = 100, Alpha = 0.05, the default equivalence alternative, Lower Limit = −5 and Upper Limit = 5.
The mean potency is 99.3153% with a standard deviation of 2.109 and a standard error of 0.3851; the tablets range from 95.19 to 103.86%. The difference from the target is −0.6847. The test against the lower limit gives t = 11.21 and the test against the upper limit t = −14.76, both with 29 degrees of freedom and p < 0.001. The 95% CI for equivalence is −1.339 to 0 (stretched to include 0), well inside −5 to 5, so the page reports that equivalence can be claimed: the batch mean is shown to be within ±5% of the label claim.
The width of the limits matters. With tighter limits of −1 and 1, the test against the lower limit gives t = 0.82 and p = 0.21, so equivalence cannot be claimed, even though the mean is only 0.68 below the target: with this sample size and spread, the data cannot rule out a mean 1% low. If only low potency is a concern, the alternative test mean − target > lower limit with a lower limit of −5 gives a single test with p < 0.001 and a 95% lower bound of −1.339.
Frequently asked questions
What is a 1-sample equivalence test?
A 1-sample equivalence test shows whether the mean of a sample is close enough to a target, within limits set in advance. The null hypothesis is that the mean is outside the limits, so a significant result is positive evidence that the difference is too small to matter. It uses two one-sided t-tests, known as TOST.
What is the difference between an equivalence test and a 1-sample t-test?
A 1-sample t-test can only say whether the mean differs from the target; a non-significant t-test does not prove the mean is on target. The equivalence test reverses the question, testing whether the difference lies inside the equivalence limits, so a significant result supports the claim that the mean is on target.
How do you interpret a 1-sample equivalence test?
Equivalence is claimed when both one-sided p-values are below alpha, which is the same as the greater p-value being below alpha, and when the confidence interval for equivalence lies inside the equivalence interval. Equivalence concerns the mean only; it does not show that every unit is inside the limits.
What are the assumptions of the 1-sample equivalence test?
The test assumes independent values from a roughly normal population; with 20 or more values, moderate skewness has little effect. The equivalence limits should be chosen from engineering or regulatory needs before looking at the data, because the width of the limits strongly affects whether equivalence can be claimed.