
Power and Sample Size for 2-Sample Equivalence Test
Plans a 2-Sample Equivalence Test that must show two independent groups have practically the same mean, such as two suppliers. Enter the equivalence limits, a pooled standard deviation and any two of sample size per group, difference and power; the tool solves for the third. Power is computed exactly for TOST with equal group sizes. Outputs a results table and a power curve.
Last reviewed
Key takeaway
Power and Sample Size for 2-Sample Equivalence Test calculates how many units each of two independent groups needs to show, with two one-sided t-tests (TOST), that their means differ by less than an equivalence window.
On this page
Purpose
Power and Sample Size for 2-Sample Equivalence Test plans a study that has to show two independent groups have practically the same mean, for example a second supplier against the current one, a new machine against an old one, or a cheaper material against the standard. You set an equivalence window for the difference (test mean − reference mean), and the tool tells you how many units each group needs to prove the difference lies inside it, what power a planned sample gives, or how large a true difference can be tolerated. Enter any two of sample size, difference and power, and the tool solves for the third. Use it before a 2-Sample Equivalence Test.
Key Capabilities
- Solves for sample size, power or difference: leave blank the one you want.
- Several values at once, e.g. differences “0 0.5” and power values “0.8 0.9”, give one row for each combination.
- Any equivalence window, symmetric or not.
- Exact power for the two one-sided tests (TOST) procedure with a pooled standard deviation and equal group sizes.
- Power curve of power against sample size for each difference, with the solved points marked.
Statistical Methods
The equivalence test uses two one-sided t-tests (TOST) on the difference of the two means. With n units in each group and a common standard deviation σ, the standard error of the difference is SE = σ·√(2/n) and the pooled t-tests have 2(n − 1) degrees of freedom. Equivalence is claimed when the difference is shown to be above the lower limit L and below the upper limit U, each one-sided test at significance level α (the Significance level (alpha) field, default 0.05).
Power is the probability that both one-sided tests succeed when the true difference is δ. It is computed exactly: for a given pooled sample standard deviation s the chance of success is Φ(−t·s/σ − (δ − U)/SE) − Φ(t·s/σ − (δ − L)/SE), with t = t₁₋α,2(n−1), and this is averaged over the chi-square distribution of the pooled variance by numerical integration. For sample size, the n per group that reaches the target power is found and rounded up, and the power at that n is reported as the actual power. When solving for the difference, the tool searches between the midpoint of the limits and the upper limit.
The difference to detect must lie strictly between the limits. Power is highest when the true difference is at the midpoint of the window and falls towards either limit. Compared with a one-sample study, two independent groups need about twice as many units per group, because both means carry sampling error.
Input Fields & Options
Field | Description |
Sample sizes | Per group. Space or comma-separated, e.g. “20 30 40”. Leave blank to solve for sample size. |
Difference(s) to detect | Space or comma-separated, e.g. “0.5 0.7”. The true difference (test mean − reference mean) you expect; must lie strictly between the limits. Leave blank to solve for it (searches between the midpoint of the limits and the upper limit). |
Power values | Space or comma-separated, e.g. “0.8 0.9”. Leave blank to solve for power. |
Lower equivalence limit / Upper equivalence limit | Required. The smallest and largest acceptable difference between the means; the lower limit must be less than the upper limit. |
Standard deviation | Required. Assumed or historical common (pooled) standard deviation of both populations. |
Significance level (alpha) | Default 0.05. Applied to each of the two one-sided tests. |
Power curve | Ticked by default: draws power against sample size. |
Title | Title shown on the output and the power curve. |
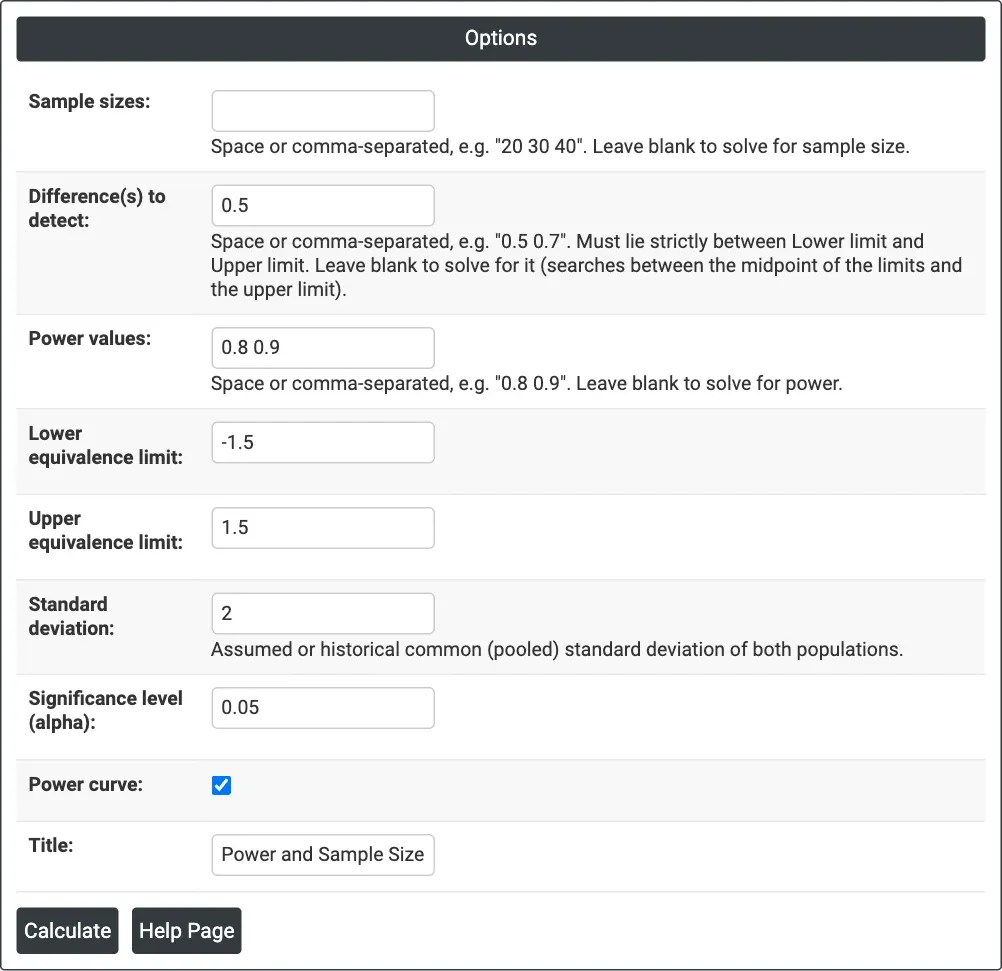
Figure 1 — Solving for sample size: Difference(s) to detect = 0.5, Power values = 0.8 0.9, limits −1.5 and 1.5, Standard deviation = 2, alpha = 0.05.
Output Descriptions
- Settings — what was solved for, the lower and upper equivalence limits, the standard deviation and the significance level.
- Results — one row per combination: difference, sample size per group, and target and actual power when solving for sample size, or power when solving for power, or difference when solving for difference.
- Power Curve — power against sample size for each difference, with the calculated points marked.
- PDF export via Download.
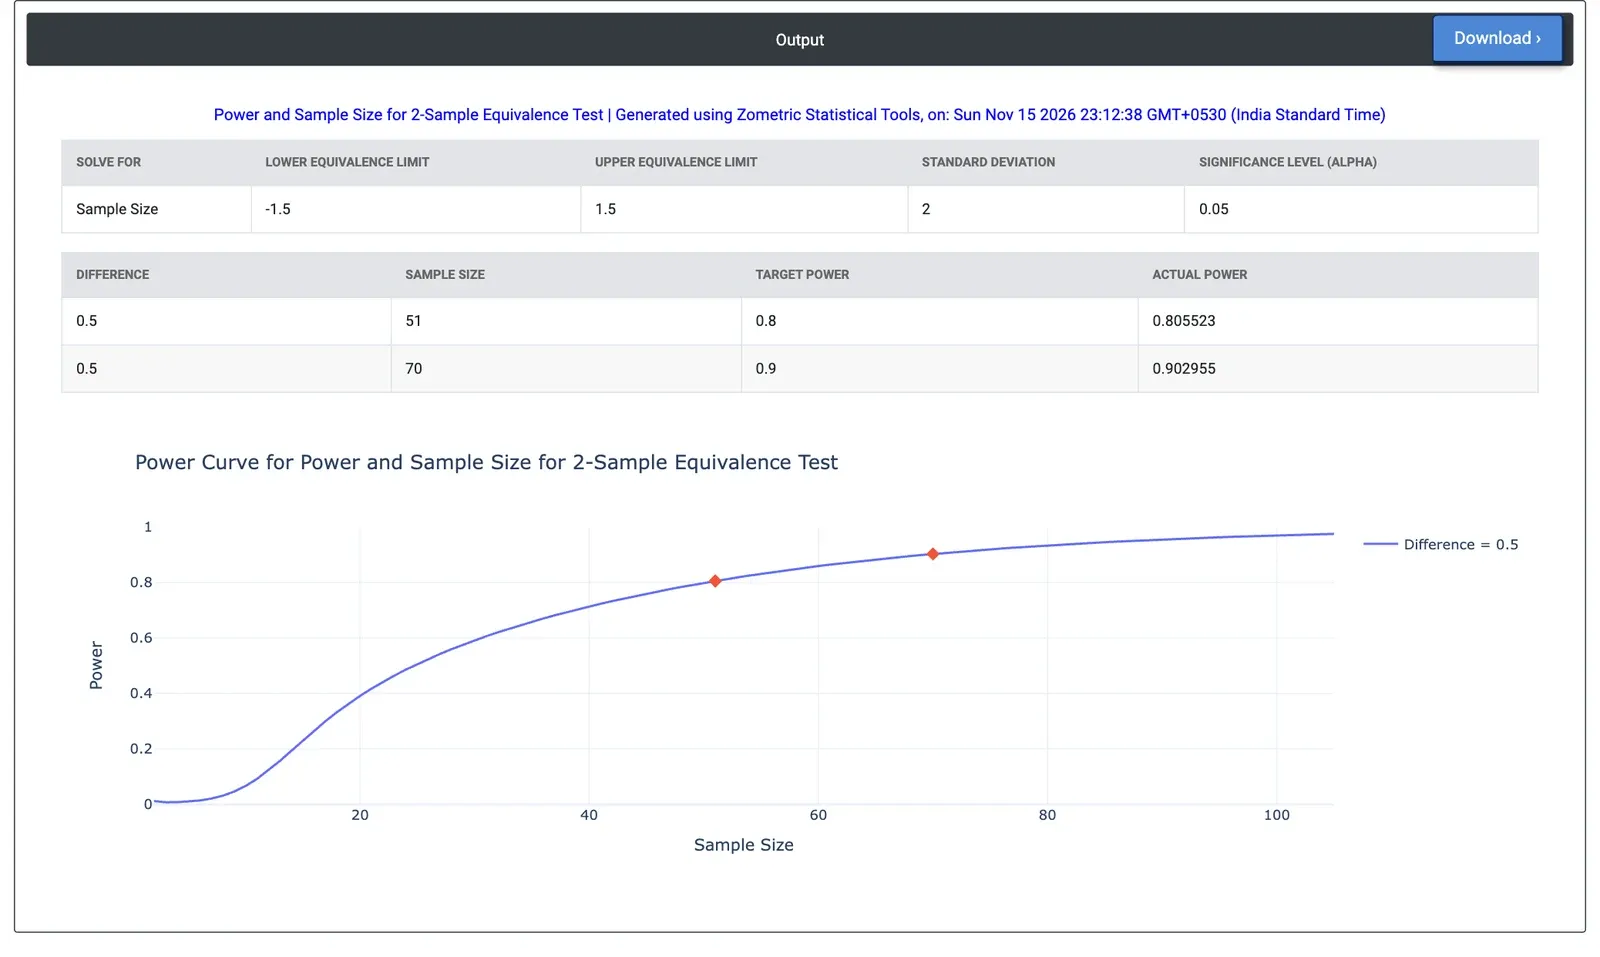
Figure 2 — Results for the example: 51 bars per supplier for 80% power and 70 for 90% power with a ±1.5 MPa window and a 0.5 MPa true difference.
Worked Example
A purchasing team wants to approve a second supplier of steel bar. The new supplier's mean yield strength must be within ±1.5 MPa of the current supplier's. Past data give a standard deviation of 2 MPa for both, and the team expects the true difference to be up to 0.5 MPa. They leave Sample sizes blank and enter Difference(s) to detect = 0.5, Power values = 0.8 0.9, Lower equivalence limit = −1.5, Upper equivalence limit = 1.5 and Standard deviation = 2, with alpha = 0.05.
The tool needs 51 bars from each supplier for 80% power (actual power 0.806) and 70 from each for 90% power (actual power 0.903). With 30 bars per supplier the power is only 0.591. If the suppliers really have the same mean (difference 0), 32 bars each give 80% power and 40 give 90%. Widening the window to ±2 MPa, if the design allows, cuts the requirement to 24 bars per supplier for 80% power at a 0.5 MPa difference.
Frequently asked questions
What does a 2-sample equivalence power analysis tell you?
It tells you how many units each of two independent groups needs to prove that the difference between their means (test mean minus reference mean) lies inside an equivalence window, what power a planned sample gives, or how large a true difference can be tolerated. Equivalence is claimed when two one-sided t-tests show the difference is above the lower limit and below the upper limit.
How many samples per group are needed for a 2-sample equivalence test?
In a worked example with a window of plus or minus 1.5 MPa, a standard deviation of 2 MPa and an expected difference of 0.5 MPa, 51 bars per supplier give 80% power and 70 give 90%. If the means are truly equal, 32 bars each give 80% power, and widening the window to plus or minus 2 MPa cuts the requirement to 24 bars.
Why does a two-sample equivalence study need more units than a one-sample study?
Both group means carry sampling error, so the standard error of the difference is the standard deviation times the square root of 2/n. As a result, two independent groups need about twice as many units per group as a one-sample study. Power is highest when the true difference sits at the midpoint of the window and falls towards either limit.
What inputs does the 2-sample equivalence power calculation need?
It requires the lower and upper equivalence limits, with the lower less than the upper, and an assumed or historical common (pooled) standard deviation. Then enter any two of sample sizes per group, differences to detect and power values. The difference must lie strictly between the limits. The significance level, default 0.05, applies to each one-sided test.