
Power and Sample Size for Paired t
Plans a paired t-test where each unit is measured twice, such as before and after a change. Enter the standard deviation of the paired differences and any two of number of pairs, mean difference and power; the tool solves for the third. It assumes roughly normal differences and uses the noncentral t distribution. Outputs a results table with actual power and a power curve.
Last reviewed
Key takeaway
Power and Sample Size for Paired t calculates how many pairs a paired t-test needs to detect a mean difference that matters, the power a planned number of pairs gives, or the smallest detectable mean difference.
On this page
Purpose
Power and Sample Size for Paired t plans a study in which each unit is measured twice, for example before and after a change, with two methods, or on two fixtures, and the question is whether the mean difference is zero. It answers how many pairs are needed to detect a mean difference that matters, what power a planned number of pairs gives, or the smallest mean difference a given number of pairs can detect. Enter any two of sample size, difference and power, and the tool solves for the third. Use it before a paired t-test.
Key Capabilities
- Solves for number of pairs, power or difference: leave blank the one you want.
- Several values at once, e.g. differences “0.5 1” and power values “0.8 0.9”, give one row for each combination.
- Two-sided (Mean difference ≠ 0) or one-sided (Mean difference < 0, Mean difference > 0) alternatives, at the confidence level you choose.
- When solving for sample size, reports the whole number of pairs and the actual power it gives.
- Power curve of power against number of pairs for each difference, with the solved points marked.
Statistical Methods
A paired t-test is a one-sample t-test on the differences within each pair, so the calculation is that of the 1-sample t applied to the differences. It assumes the differences are roughly normal with standard deviation σ_d. The significance level is α = 1 − confidence level / 100, and the standardised difference is d = mean difference / σ_d.
Power is computed from the noncentral t distribution with n − 1 degrees of freedom and noncentrality parameter δ = d·√n, where n is the number of pairs: for a two-sided test, power = P(T > t₁₋α/₂) + P(T < −t₁₋α/₂); for a one-sided test only the tail on the side of the alternative counts, so a mean difference on the other side gives a power near 0 (and solving for sample size from it returns an error message). For sample size, the n that gives the target power is found and rounded up, and the power at that n is reported as the actual power. For difference, the smallest mean difference that reaches the target power with the given n is found.
The standard deviation to enter is that of the paired differences, not of the individual readings. When the two readings on a unit move together, σ_d is much smaller than the unit-to-unit spread, which is why a paired design usually needs far fewer units than two independent groups. Power rises with the number of pairs and the difference, and falls as σ_d grows.
Input Fields & Options
Field | Description |
Sample sizes | Number of pairs. Space or comma-separated, e.g. “10 20 30”. Leave blank to solve for sample size. |
Differences | Space or comma-separated, e.g. “1 2 3”. The mean paired difference you want to detect. Leave blank to solve for difference. |
Power values | Space or comma-separated, e.g. “0.8 0.9”. Leave blank to solve for power. |
Standard deviation of the differences | Required. Assumed or historical standard deviation of the paired differences, e.g. from a pilot run. |
Confidence level | Default 95 (α = 0.05); 75 to 100. |
Alternative hypothesis | Mean difference ≠ 0 (default), Mean difference < 0 or Mean difference > 0. |
Power curve | Ticked by default: draws power against sample size. |
Title | Title shown on the output and the power curve. |
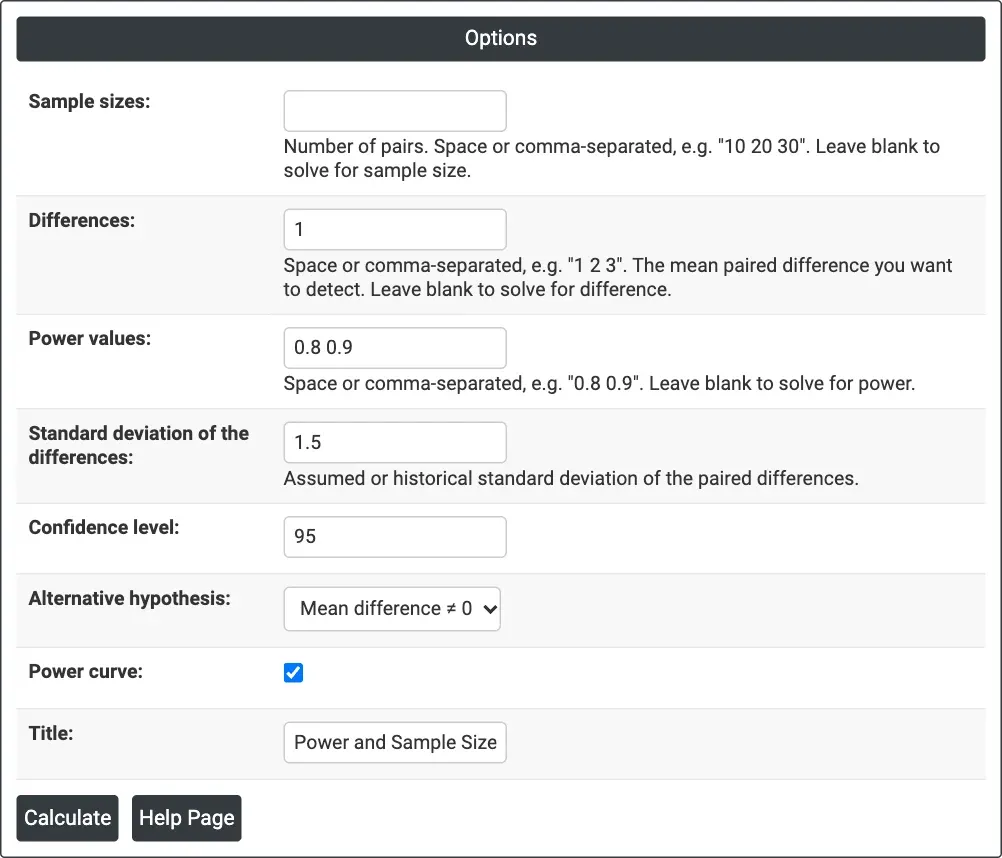
Figure 1 — Solving for sample size: Differences = 1, Power values = 0.8 0.9, Standard deviation of the differences = 1.5, two-sided at 95% confidence.
Output Descriptions
- Settings — what was solved for, the standard deviation of differences, the confidence level and the alternative hypothesis.
- Results — one row per combination: difference, sample size (pairs), and target and actual power when solving for sample size, or power when solving for power, or difference when solving for difference.
- Power Curve — power against sample size for each difference, with the calculated points marked.
- PDF export via Download.
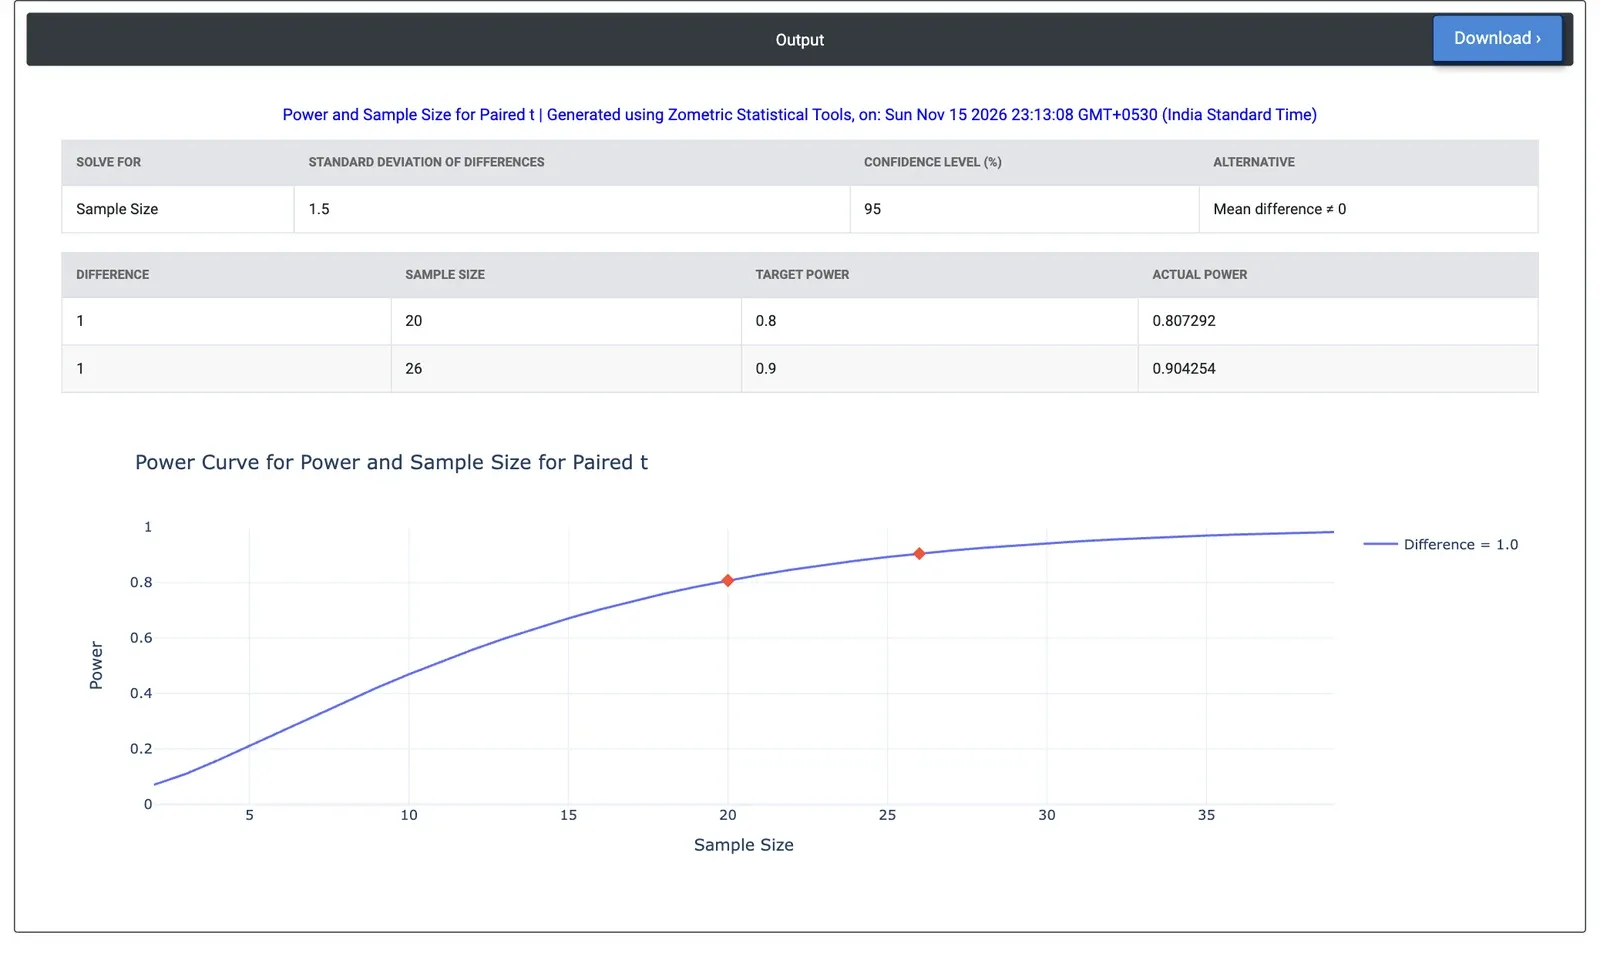
Figure 2 — Results for the example: 20 engines for 80% power and 26 for 90% power to detect a 1 g/kWh change in fuel consumption.
Worked Example
An engine plant is trialling new calibration software and will test each engine on the bench before and after the update. A change of 1 g/kWh in specific fuel consumption would matter, and earlier before-and-after tests put the standard deviation of the differences at 1.5 g/kWh. The test engineer leaves Sample sizes blank, enters Differences = 1, Power values = 0.8 0.9 and Standard deviation of the differences = 1.5, and keeps the two-sided alternative at 95% confidence.
The tool needs 20 engines for 80% power (actual power 0.807) and 26 for 90% power (actual power 0.904). The 12 engines available in one week would give a power of 0.558. If the bench results are noisier than expected, with σ_d = 2 g/kWh, 34 engines are needed for 80% power. If the only question is whether consumption improves, a one-sided alternative needs 16 engines for 80% power.
Frequently asked questions
How is power calculated for a paired t-test?
A paired t-test is a one-sample t-test on the differences within each pair, so power is computed from the noncentral t distribution with n - 1 degrees of freedom and noncentrality parameter d times the square root of n, where n is the number of pairs and d is the mean difference divided by the standard deviation of the differences.
Why does a paired design need fewer units than two independent groups?
When the two readings on a unit move together, the standard deviation of the paired differences is much smaller than the unit-to-unit spread. Because power depends on the mean difference relative to that standard deviation, a paired design usually needs far fewer units than two independent groups. Enter the standard deviation of the differences, not of individual readings.
How many pairs are needed for a paired t-test?
In a worked example detecting a 1 g/kWh change with a standard deviation of differences of 1.5 g/kWh, two-sided at 95% confidence, 20 engines give 80% power and 26 give 90%. Twelve engines give a power of 0.558. If the differences are noisier, at 2 g/kWh, 34 engines are needed for 80% power.
Should a paired t-test be one-sided or two-sided?
Use a one-sided alternative when only one direction matters, such as whether consumption improves; in the worked example it needs 16 engines instead of 20 for 80% power. A one-sided test only counts the tail on the side of the alternative, so a mean difference on the other side gives a power near 0 and solving for sample size returns an error.