
Process Flow Diagram
The Process Flow Diagram draws a flowchart from one worksheet row per step, with process-chart symbols, decisions, rework loops, optional swim lanes and special characteristics. Use it in APQP as the basis for the PFMEA and control plan. It does no statistics; it checks the flow against the APQP process flow checklist and outputs the flowchart, a Process Flow table, step counts and review notes.
Last reviewed
Key takeaway
A process flow diagram (process map) shows every step a product goes through, from receiving material to shipping, in work order, and is the starting point for the PFMEA and control plan in APQP.
On this page
Purpose
A process flow diagram (process map) shows every step a product goes through, from receiving the material to shipping it, in the order the work is done. It is the starting point of process risk work in APQP: the PFMEA analyses the failure modes of each step in the flow, and the control plan controls the characteristics made or checked at each step. The tool draws the flowchart from one worksheet row per step and checks the flow against the usual checklist for a process flow chart.
Key Capabilities
- Flowchart drawn from the worksheet: one box per step with its process-chart symbol (operation, inspection, operation with inspection, transport, storage, delay), decision diamonds, rework steps and start/end terminators.
- Branches and rework loops from the Next column: a link to a step further down is drawn as a branch; a link back up the flow is a rework loop, drawn dashed in orange, and the step it returns to is a re-entry point.
- Optional swim lanes: one column per department or area from the Lane column.
- Special characteristics marked with a red ◆ on the steps that make or check them.
- Process Flow table with each step's machine, product characteristics, process characteristics, class and next steps, ready to carry into the PFMEA and the control plan.
- Steps by Symbol counts, the list of rework loops and re-entry points, and Review Notes.
- PDF export via Download.
Statistical Methods
The tool does no statistics: it lays out the steps and checks the flow. Rows are read in worksheet order. A blank Next means the step goes to the next row; a Next lists one or more Step No. values or step names separated by semicolons, and End (or a dash) ends the flow there. The last row and any start/end step after the first have no exit unless a Next is given. A blank Symbol is taken from the step text: a step starting with inspect, check, test or measure is an inspection, move or transport a transport, store a storage step, wait or hold a delay, a step mentioning rework or repair a rework step, and a step ending in a question mark a decision; anything else is an operation.
Steps are placed in layers from top to bottom by the longest path through the forward links, so a step always sits below every step that leads to it. The first exit of a step continues straight down; further exits branch to the right. Links are routed through the gaps between the boxes. A link to an earlier row is a rework loop and is drawn down from the step, along a channel on the left and into the re-entry step from above.
The Review Notes follow the APQP process flow chart checklist: the flow should cover the whole process from receiving through shipping; handling and storage steps should be shown, because risks left off the flow chart are usually missed by the PFMEA and the control plan too; reworked product should pass an inspection before it is used again; decisions need at least two labelled exits; every step should be reachable from the first one; operations should list their product or process characteristics; and the steps that make or check special characteristics should be marked. A Next that names no step in the worksheet is reported and left out.
Input Fields & Options
Field | Description |
Worksheet | One row per process step, in flow order. Columns are recognised by their headings. Required: Process Step (also Step, Operation, Activity or Description). Optional: Step No., Symbol (or Type), Next, Condition (a label for each Next, in the same order, e.g. Pass; Fail), Lane (or Department, Area), Machine (or Equipment, Station), Product Characteristics, Process Characteristics, Class (special characteristic, e.g. CC / SC). Without a Step No. column the steps are numbered 10, 20, 30 … |
Project Name | Report header; in a Workspace roadmap project it is shared with the other forms. |
Diagram Title | Title of the flowchart. Default Process Flow Diagram. |
Part Number / Latest Change Level, Part Name / Description, Organization / Plant, Prepared By, Prepared Date, Revision | Report header fields. |
Swim lanes | Ticked by default: one column per value of the Lane column, in the order the lanes first appear. Unticked, or with no Lane column, the flow is drawn in one column with branches to the right. |
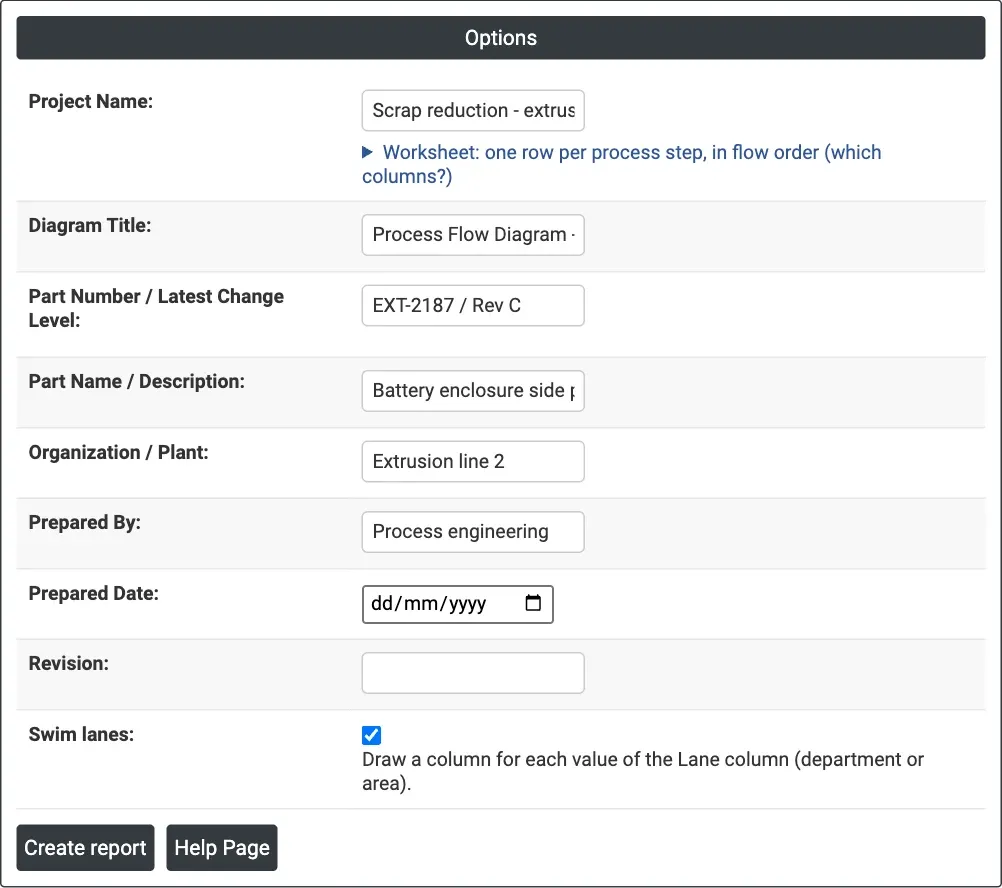
Figure 1 — Options for the example: header of the process flow diagram for extrusion line 2, with swim lanes on.
Output Descriptions
- Header — the report fields from the Options panel.
- Flowchart — the steps with their symbols, step numbers, branch labels, rework loops (dashed orange), special characteristics (◆) and a legend of the symbols used. Hovering over a step shows its machine and characteristics.
- Process Flow — Step No., Symbol, Process Step, Lane, Machine / Equipment, Product Characteristics, Process Characteristics, Special Char. Class and Next (with the condition of each exit). Empty optional columns are left out.
- Steps by Symbol — the number of steps of each kind, the total and the number of rework loops.
- Rework Loops and Re-entry Points — for each loop, the step it leaves from, the step it returns to and its condition.
- Review Notes — the checklist findings; not shown when there are none.
- PDF export via Download.
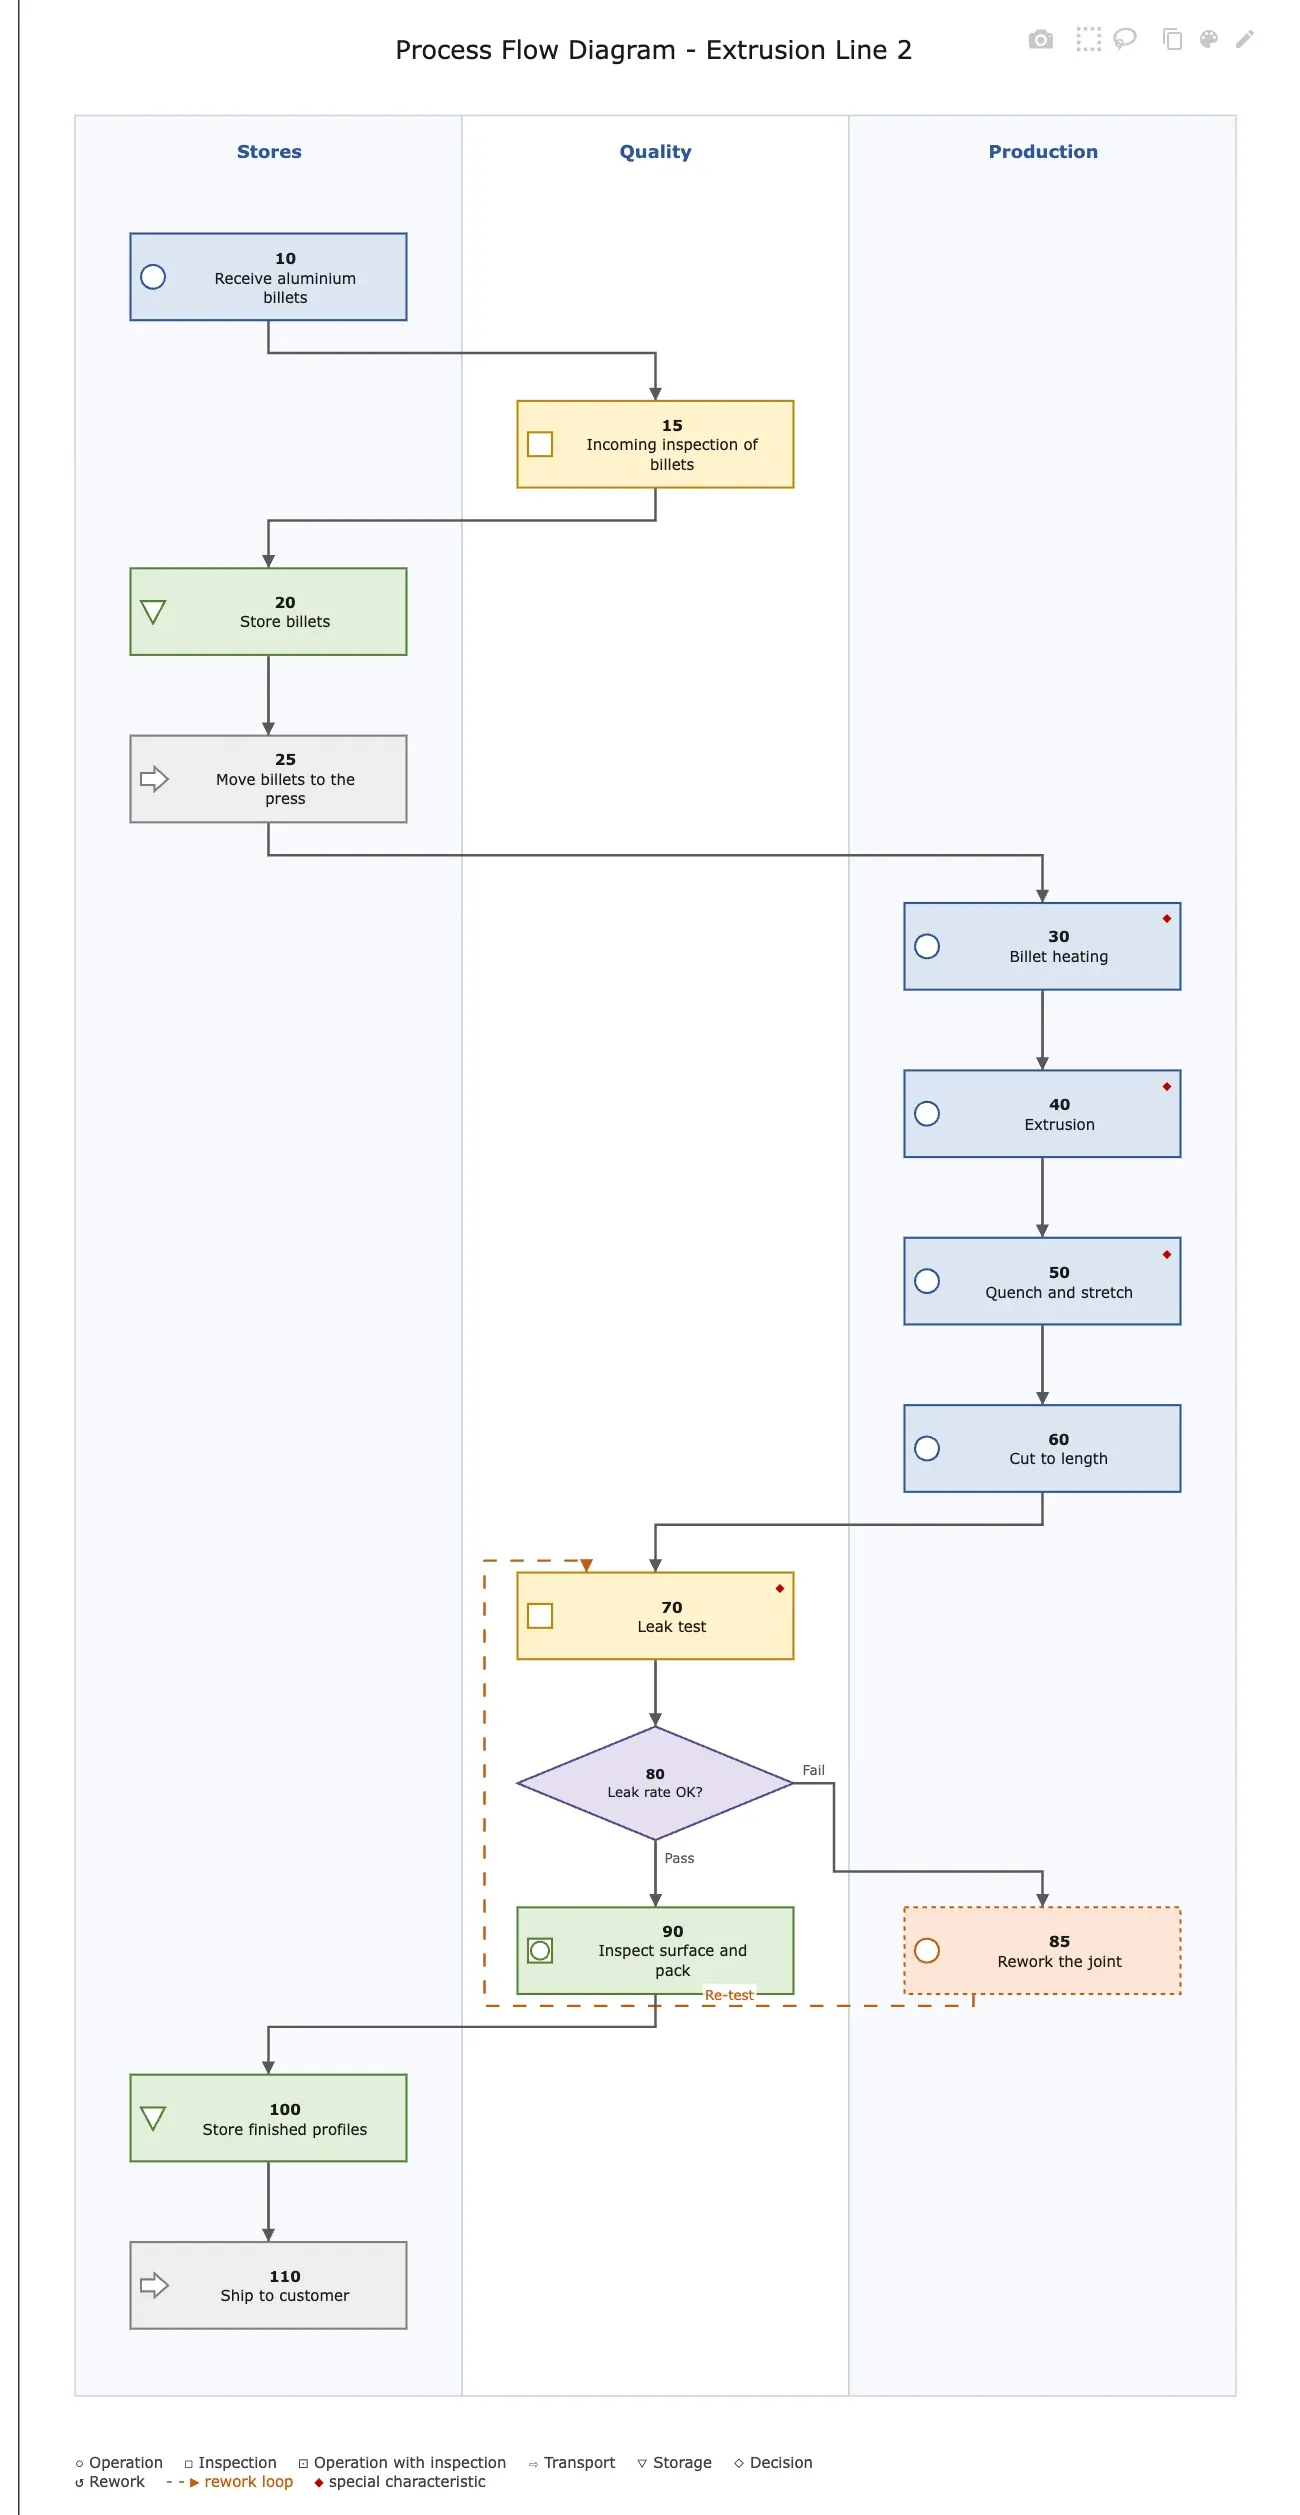
Figure 2 — Process flow diagram of extrusion line 2 in three swim lanes, with the leak-test decision and the rework loop back to the leak test.
Worked Example
To keep the control plan of extrusion line 2 complete, the team maps the process for the battery enclosure side profile (EXT-2187) from receiving the aluminium billets to shipping. The worksheet has 14 rows in flow order with Step No., Symbol, Next, Condition, Lane (Stores, Quality, Production), Machine, Product Characteristics, Process Characteristics and Class. Wall thickness (step 40) and leak rate (step 70) are critical characteristics (CC); billet temperature (30) and quench water temperature and hardness (50) are significant (SC).
The flowchart moves between the three lanes: Stores receives, stores and moves the billets, Production heats, extrudes, quenches and cuts them, and Quality runs the incoming inspection, the leak test and the final inspection and packing. The leak-test decision (step 80) has two exits: Pass goes on to step 90, and Fail goes to Rework the joint (85), whose Next of 70 sends the part back to the leak test. The Rework Loops table lists this one loop with step 70 as its re-entry point, so reworked parts are tested again before they are packed.
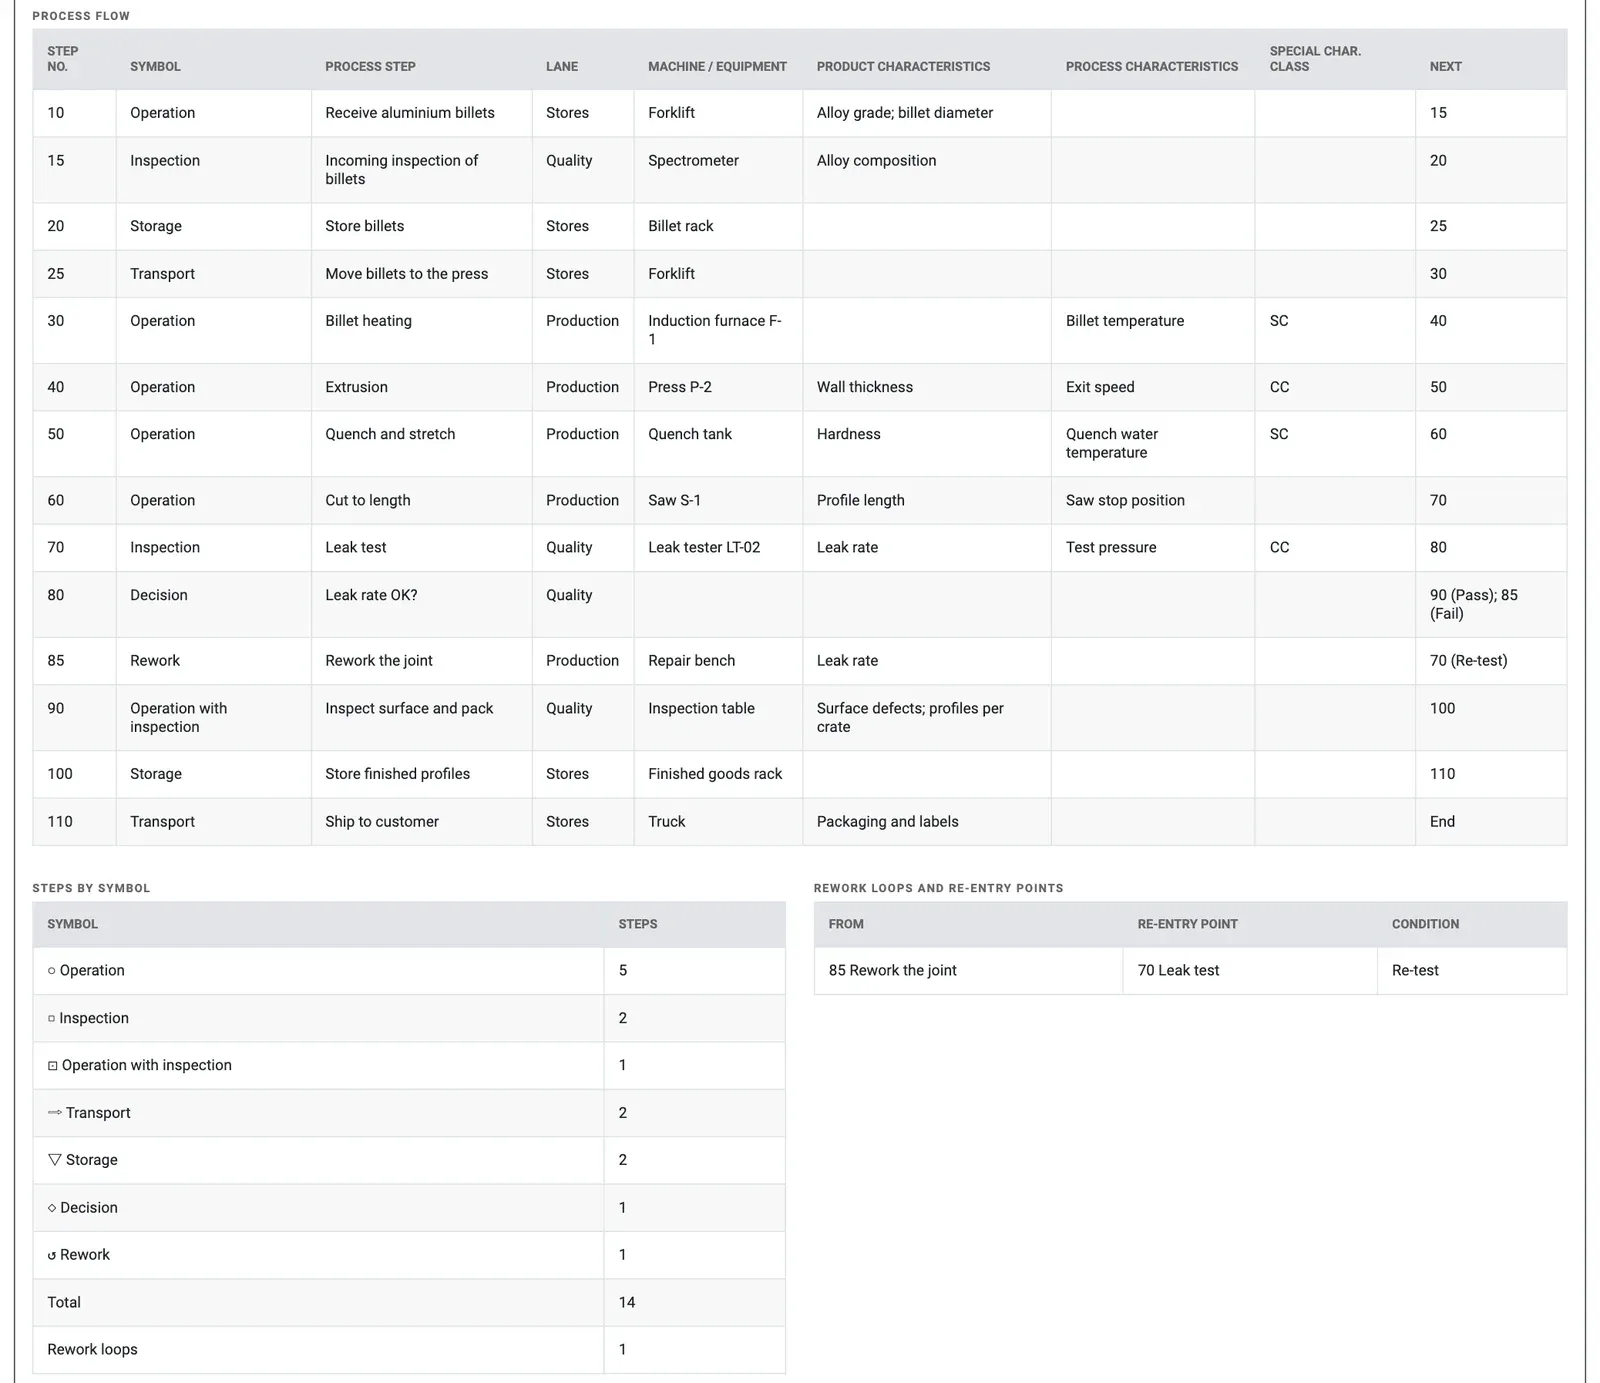
Figure 3 — Process Flow table, Steps by Symbol and the rework loop of the example.
Steps by Symbol counts 14 steps: 5 operations, 2 inspections, 1 operation with inspection, 2 transports, 2 storage steps, 1 decision and 1 rework step, with 1 rework loop. There are no Review Notes: the flow runs from receiving to shipping, shows handling and storage, inspects reworked parts, labels both decision exits and marks the special characteristics. The Process Flow table now gives the PFMEA its steps and the control plan its characteristics, with the same step numbers in all three documents.
Frequently asked questions
What is a process flow diagram used for in APQP?
A process flow diagram shows every step a product goes through, from receiving the material to shipping it, in the order the work is done. It is the starting point of process risk work in APQP: the PFMEA analyses the failure modes of each step in the flow, and the control plan controls the characteristics made or checked at each step.
What symbols are used in a process flow diagram?
Steps use process-chart symbols for operation, inspection, operation with inspection, transport, storage and delay, plus decision diamonds, rework steps and start and end terminators. If no symbol is given, it is inferred from the step text: for example, a step starting with inspect, check, test or measure is an inspection, and a step ending in a question mark is a decision.
What should a process flow chart checklist cover?
The flow should cover the whole process from receiving through shipping and show handling and storage steps, because risks left off the flow chart are usually missed by the PFMEA and control plan too. Reworked product should pass an inspection before reuse, decisions need at least two labelled exits, every step should be reachable, and steps making or checking special characteristics should be marked.
How do you build a process flow diagram in Zometric Statistical Software?
Enter one worksheet row per process step in flow order. Process Step is required; optional columns include Step No., Symbol, Next, Condition, Lane, Machine, Product Characteristics, Process Characteristics and Class. A Next pointing to an earlier step is drawn as a dashed rework loop. Swim lanes are drawn by default from the Lane column.