
Sample Size for Estimation
Sample Size for Estimation plans a study whose aim is to measure a mean or proportion precisely rather than test a difference. Enter target margins of error to get sample sizes, or sample sizes to get margins. A mean needs an assumed standard deviation and uses the t distribution; a proportion needs a planning value, 0.5 by default, and uses the normal approximation.
Last reviewed
Key takeaway
Sample Size for Estimation calculates how many observations are needed to estimate a mean or a proportion to a chosen margin of error, the half-width of the confidence interval, or the margin a given sample achieves.
On this page
Purpose
Sample Size for Estimation works out how many observations are needed to estimate a mean or a proportion to a chosen precision, or how precise the estimate will be with a given sample. Precision is expressed as the margin of error: the half-width of the confidence interval, so that the estimate is “value ± margin”. Use it when the aim is to measure something well, such as the average cycle time, the mean coating weight or the share of late orders, rather than to test a difference (for that, use the power and sample size tools for hypothesis tests).
Key Capabilities
- Estimates a Mean (with an assumed standard deviation) or a Proportion (with a planning value).
- Solves for sample size from target margins of error, or for the margin of error from planned sample sizes: leave blank the one you want.
- Several values at once, e.g. margins “0.5 1”, give one row each.
- When solving for sample size, reports the whole number of observations and the margin of error it actually achieves.
- Any confidence level from 75 to 100%.
Statistical Methods
For a mean, the standard deviation entered is a planning value rather than a known one, so the margin of error uses the t distribution, as does the confidence interval you will later compute from the data (Minitab works the same way when σ is not known). For a proportion the tool uses the normal approximation. With confidence level C, α = 1 − C/100; z = z₁₋α/₂ (1.960 for 95%) and t = t₁₋α/₂ with n − 1 degrees of freedom.
For a mean with assumed standard deviation σ, the margin of error with n observations is E = t·σ/√n. Because t depends on n, the sample size for a target margin E is the smallest n whose margin is at most E: the tool starts from the normal answer (z·σ/E)², rounded up, and steps up one at a time. For a proportion with planning value p, the margin is E = z·√(p(1 − p)/n), so n = z²·p(1 − p)/E², rounded up to the next whole number. In both cases the margin at the reported n is shown as the actual margin of error, which is at most the target.
The margin falls with the square root of n: halving the margin needs about four times as many observations. For a mean, the margin assumes the sample standard deviation comes out close to the planning value; if the data are more variable, the interval will be wider. For a proportion, a planning value of 0.5 gives the largest (safest) sample size; use a smaller value only if you are confident the proportion is far from 0.5. The result assumes a random sample from a stable process.
Input Fields & Options
Field | Description |
Parameter to estimate | Mean (default) or Proportion. |
Sample sizes | Space or comma-separated, e.g. “10 20 30”. Leave blank to solve for sample size. |
Margins of error | Space or comma-separated, e.g. “1 2”. The half-width of the confidence interval, in measurement units for a mean or as a fraction (e.g. 0.03) for a proportion. Leave blank to solve for margin of error. |
Assumed standard deviation | Required when Parameter = Mean. Historical or pilot estimate of the standard deviation, used as a planning value (the margin uses the t distribution). |
Planning value for the proportion | Required when Parameter = Proportion; default 0.5, between 0.0001 and 0.9999. 0.5 is the most conservative (largest sample size) choice. |
Confidence level | Default 95; 75 to 100. |
Title | Title shown on the output. |
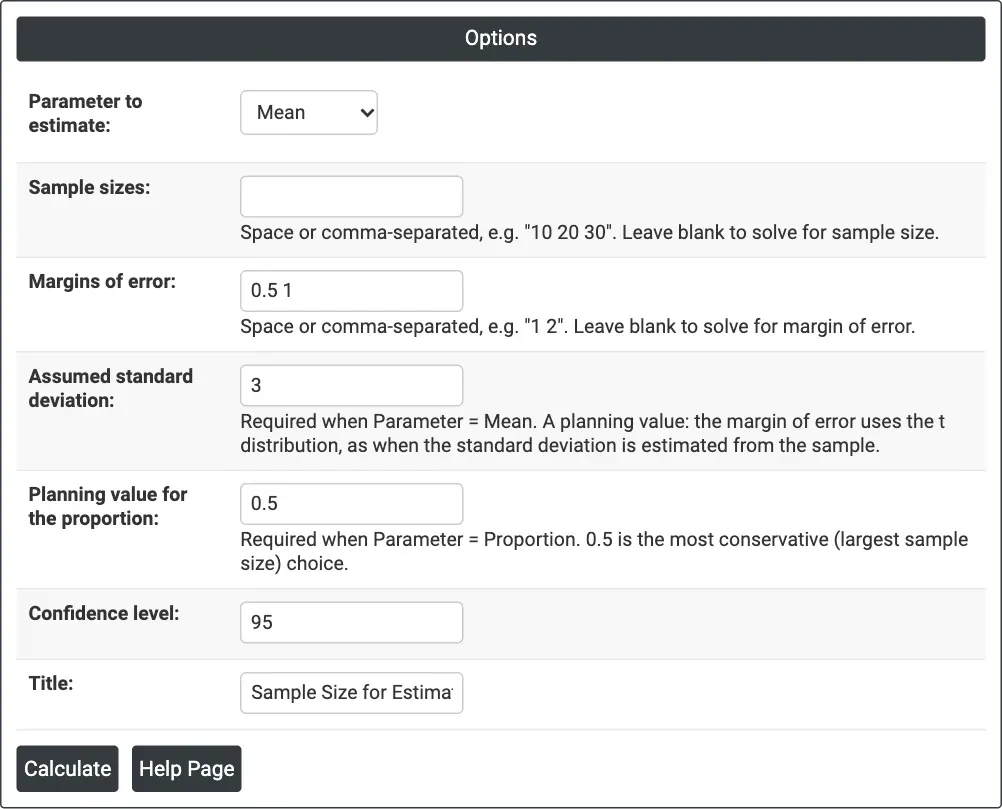
Figure 1 — Solving for sample size for a mean: Margins of error = 0.5 1, Assumed standard deviation = 3, at 95% confidence.
Output Descriptions
- Settings — what was solved for, the parameter, the confidence level and the assumed standard deviation (for a mean) or the planning value (for a proportion).
- Results — one row per value: margin of error, sample size and actual margin of error when solving for sample size, or sample size and margin of error when solving for margin of error.
- PDF export via Download.
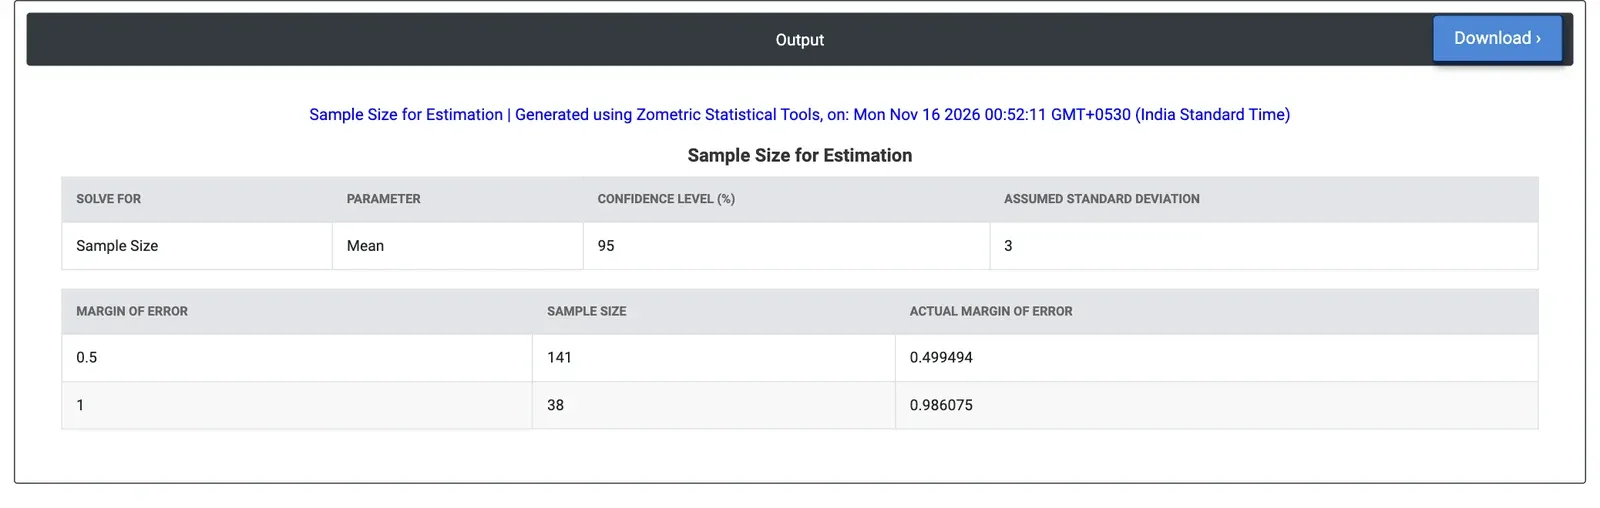
Figure 2 — Results for the example: 141 cycles for a ±0.5 s margin and 38 cycles for a ±1 s margin at 95% confidence.
Worked Example
An industrial engineer needs the average cycle time of a manual assembly station for a line-balancing study. A short pilot shows a standard deviation of about 3 seconds. The engineer would like the mean to within ±0.5 s, but could accept ±1 s. With Parameter to estimate = Mean, the engineer leaves Sample sizes blank, enters Margins of error = 0.5 1 and Assumed standard deviation = 3, at 95% confidence.
The tool needs 141 timed cycles for a ±0.5 s margin (actual margin 0.499 s) and 38 cycles for ±1 s (actual margin 0.986 s): halving the margin multiplies the work by about four. Entering Sample sizes = 20 50 instead shows that 20 cycles give a margin of ±1.40 s and 50 give ±0.85 s. At 99% confidence the requirements rise to 243 and 64 cycles. For a proportion, for example the share of cycles with a rework step, a margin of ±0.03 needs 1068 observations with the conservative planning value 0.5, but 385 if the share is known to be around 0.1.
Frequently asked questions
How do you calculate the sample size to estimate a proportion?
For a proportion with planning value p, the margin of error is E = z times the square root of p(1 - p)/n, so n = z squared times p(1 - p) divided by E squared, rounded up. A planning value of 0.5 gives the largest, safest sample size; in a worked example a margin of 0.03 at 95% confidence needs 1068 observations with 0.5, but 385 with 0.1.
How do you calculate the sample size to estimate a mean?
For a mean with assumed standard deviation sigma, the margin of error with n observations is E = t times sigma divided by the square root of n. Because t depends on n, the tool starts from the normal answer (z times sigma / E) squared and steps up until the margin is at most the target. The actual margin at that n is reported.
How does the margin of error change with sample size?
The margin of error falls with the square root of n, so halving the margin needs about four times as many observations. In a worked example with a standard deviation of 3 seconds at 95% confidence, a margin of 1 second needs 38 cycles, while a margin of 0.5 seconds needs 141 cycles.
When should you use sample size for estimation instead of power and sample size?
Use sample size for estimation when the aim is to measure something well, such as an average cycle time, mean coating weight or share of late orders. When the aim is to test a difference, use the power and sample size tools for hypothesis tests instead. The result assumes a random sample from a stable process.