
One Sample Z Test
The one-sample z-test compares the mean of one sample with a target value when the population standard deviation (σ) is known from past data or a specification. You enter the data column, the known σ and the hypothesized mean. Zometric gives the sample mean, a confidence interval, the z-value and p-value, with a box plot and histogram. If σ is not known, use the one-sample t-test.
Last reviewed
Key takeaway
A one-sample z-test checks whether a sample mean differs from a hypothesized mean when the population standard deviation is known in advance, and gives a confidence interval for the true mean.
On this page
What is a One Sample Z Test?
A one-sample z-test checks whether the mean of one sample differs from a target value. It uses the standard normal distribution, and it needs the population standard deviation (σ) to be known before you start.
The test statistic is:
z = (sample mean − hypothesized mean) ÷ (σ ÷ √n)
where n is the sample size. The bottom part, σ ÷ √n, is the standard error of the mean. Because σ is known, the tool uses it directly instead of estimating the spread from the sample. That is the difference from the one-sample t-test.
The null hypothesis is that the population mean equals the hypothesized mean. The alternative says the mean is different, lower or higher. The tool also gives a confidence interval for the true mean.
In practice σ is known when it comes from a long history of measurements on a stable process, from a measurement system study, or from a standard. If you have to estimate σ from the same sample, use the t-test.
When to use it
Use the one-sample z-test when:
- You have one sample of continuous measurements, such as weights, concentrations or times.
- You want to compare its mean with a target, such as a specification or an advertised value.
- The population standard deviation is truly known, from past studies or historical data.
Typical questions:
- Quality control: Is the average fill weight of a line still on the 500 g target, when the process standard deviation is known to be 4 g?
- Food and packaging: Is the average fat content of a sauce equal to the 15% on the label?
- Lab work: Is the mean reading of a stable instrument different from a reference value?
Check that:
- σ is known and constant. Do not use the sample's own standard deviation as σ.
- Observations are independent and random. Each value must not depend on another.
- The mean is close to normal. If the data are roughly normal, any sample size works. If not, use more than 20 observations and make sure the data are not strongly skewed. Check the histogram and box plot.
When not to use it, and what to use instead:
- σ is unknown and estimated from the sample: use the One Sample T Test.
- The data are strongly non-normal and the sample is small: use the One Sample Wilcoxon or One Sample Sign test.
- The data are pass/fail: use the One Sample Proportion Test.
- The data are counts of defects per unit: use the One Sample Poisson Rate Test.
- You want to compare two groups: use the Two Sample T Test.
- You want to check whether the data are normal: use the Normality Test.
- You want to plan how many observations you need: use Power and Sample Size for 1-Sample Z.
- You only have the sample size and the sample mean: use One Sample Z Test (Summarized) in the Statistical Workspace.
Data you need
Put the measurements in one column, one value per row. The column name goes in the first row. You can have more than one column; each column is then analyzed as a separate sample, with the same known standard deviation and hypothesized mean.
Percent Fat | Sample ID |
|---|---|
15.2 | 1 |
12.4 | 2 |
15.4 | 3 |
… | … |
Other columns, such as the sample ID here, are ignored unless you select them. Blank cells are treated as missing.
How to run One Sample Z Test in Zometric
Sign in to Zometric Statistical Software. You can run the One Sample Z Test in the Statistical Workspace, where most people work, or on its own tool page.
In the Statistical Workspace
- Open Statistical Workspace.
- In the Data grid, type the column names in the first (grey) row, then type or paste (Ctrl+V) your data below. Put the measurements in one column, one value per row.
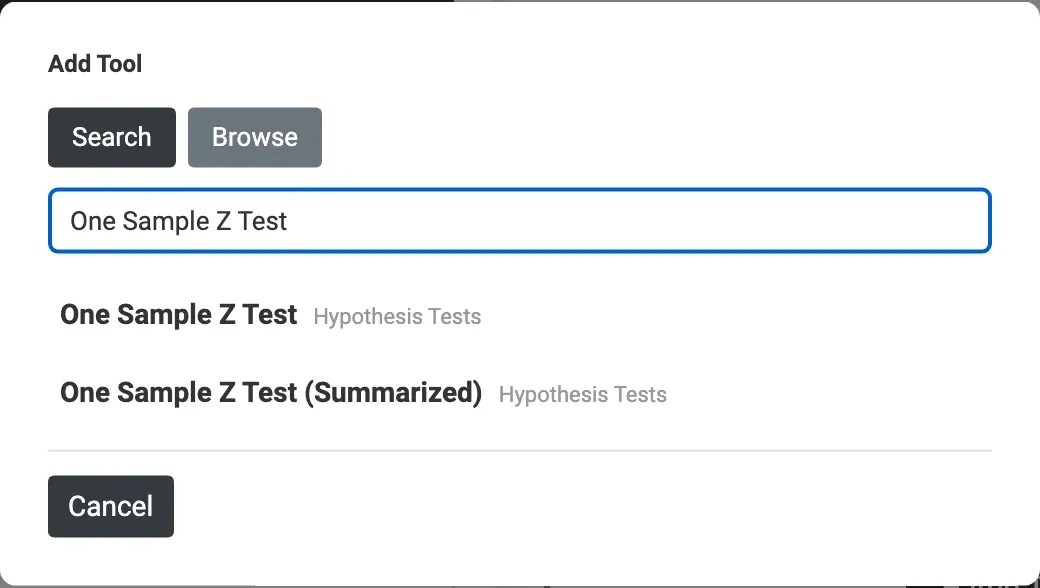
- Click + Add Tool, search for One Sample Z Test and open it. You can also find it under Browse › Basic Statistics. Do not pick One Sample Z Test (Summarized), which is for a sample size and mean only.
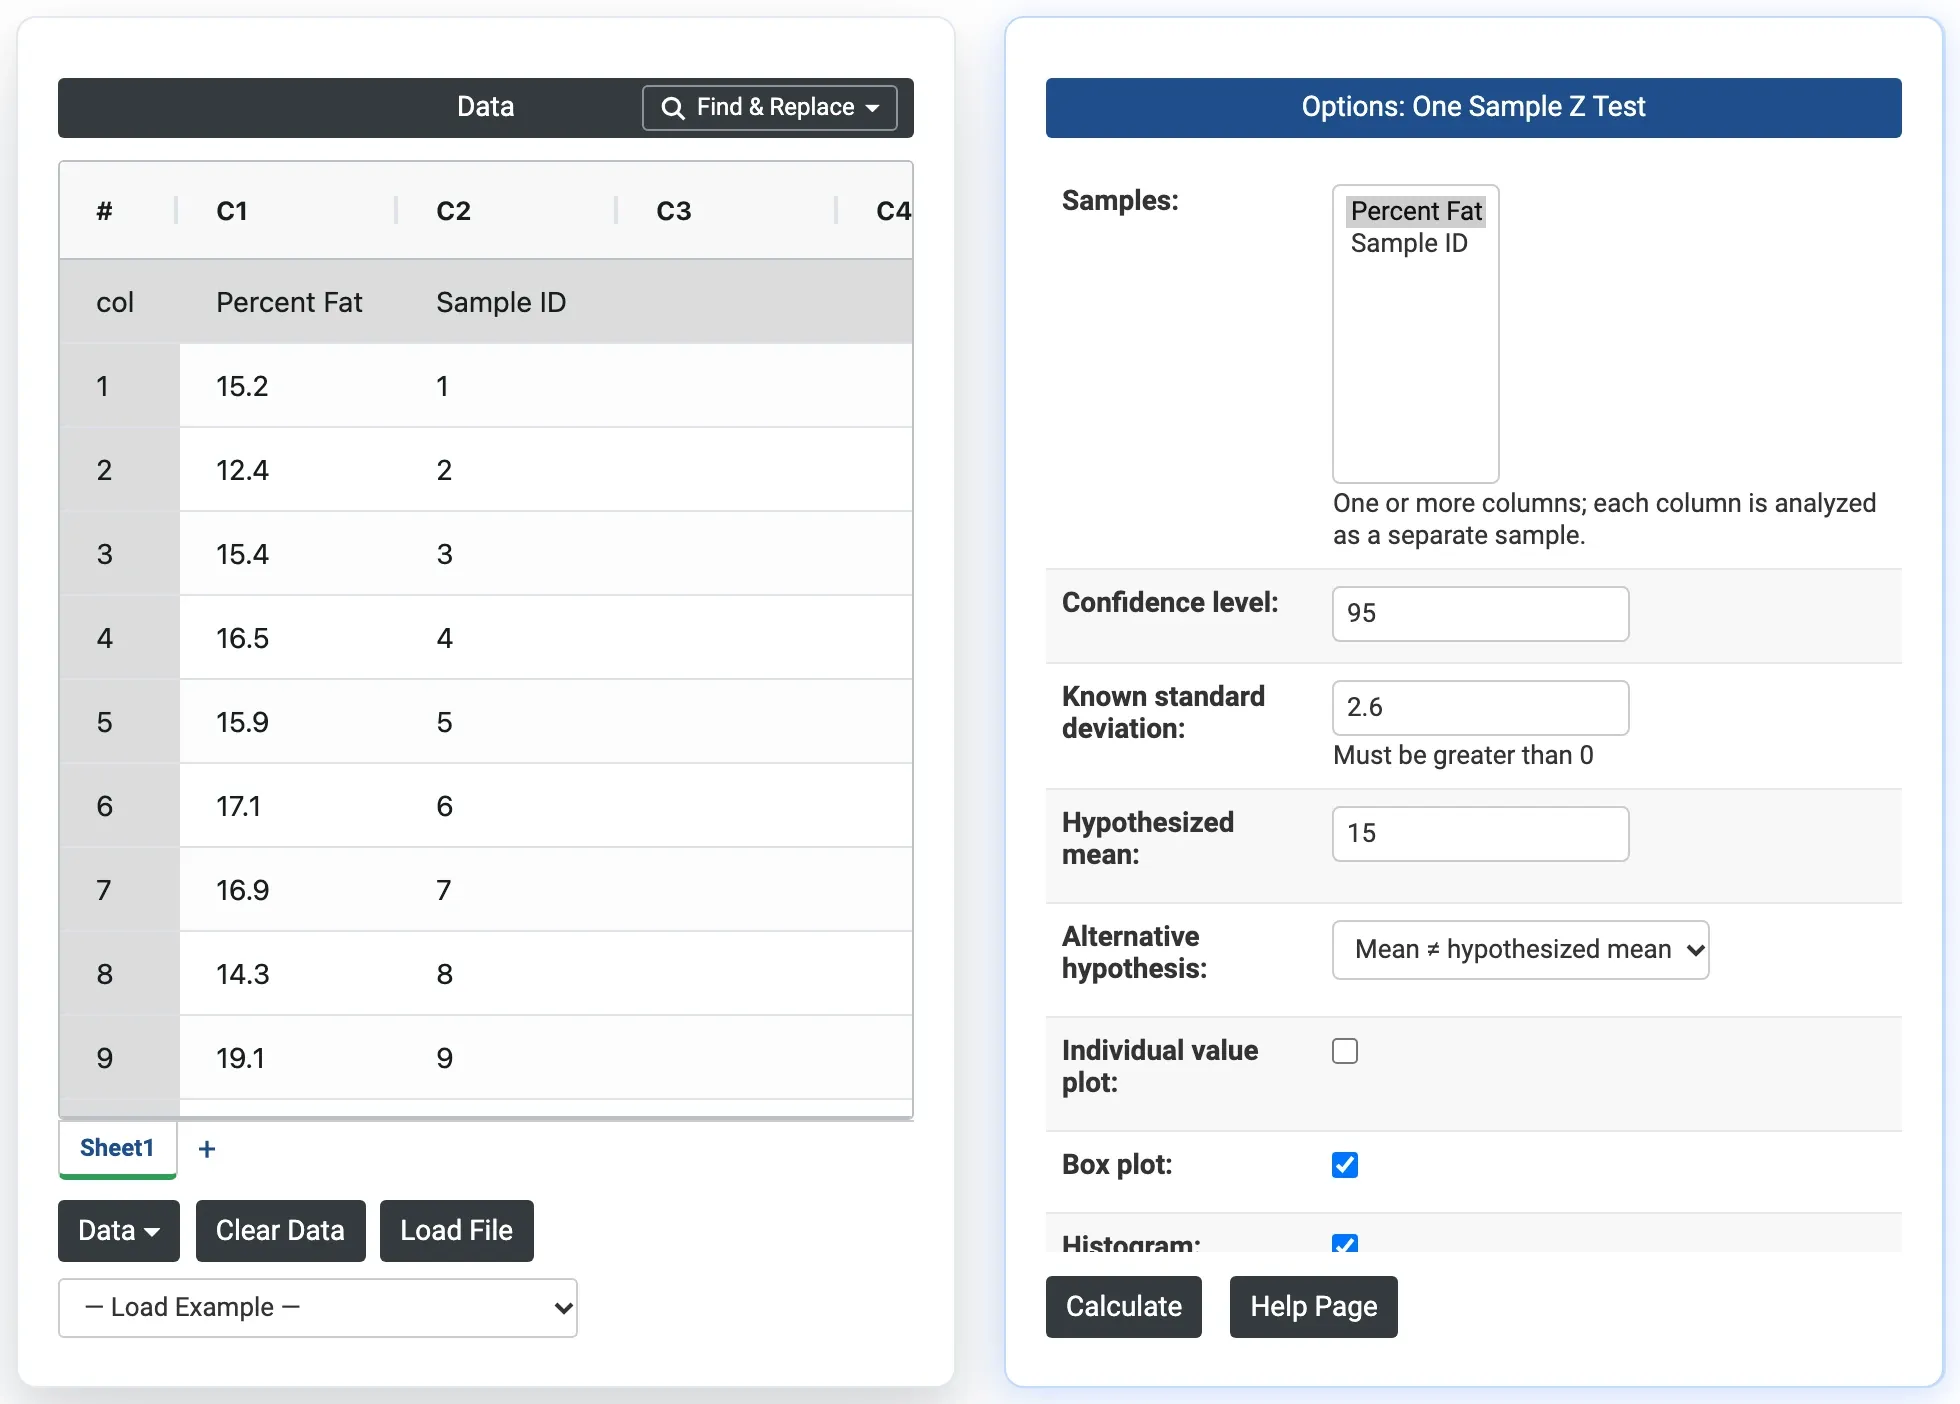
- In Options: One Sample Z Test, choose your column, the known standard deviation and the hypothesized mean (see Options below).
- Click Calculate. The results appear above the data.
- To keep them, use Download › (PDF, Word or Excel), or Export › to put several analyses into one file.
Only columns with a value in the first data row are sent to the tool, so don't leave the first cell of a column blank.
On the tool page
- Open Statistical Tools and click One sample z test (category: Hypothesis Tests).
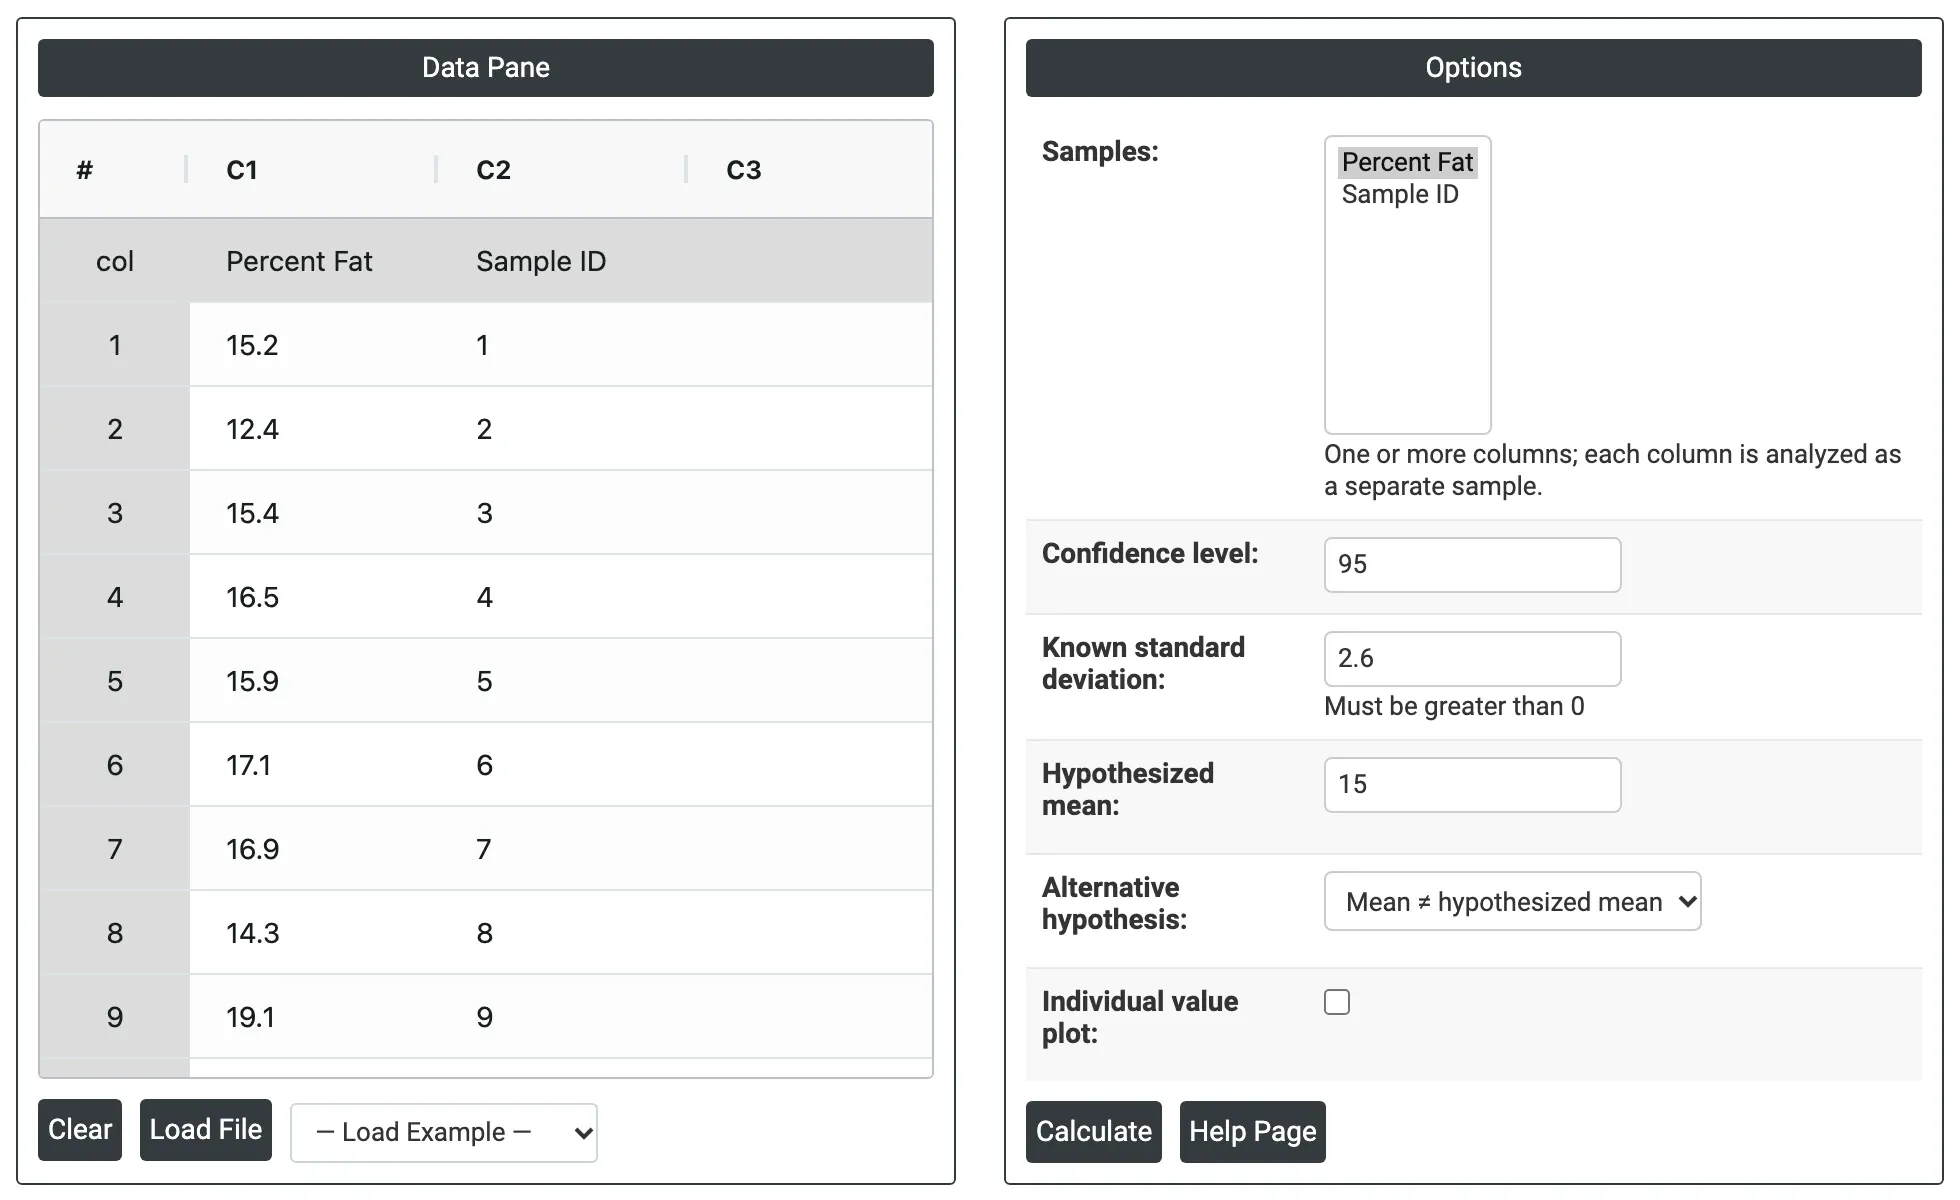
- Enter data in the Data Pane the same way, use Load File to open an Excel or CSV file, or pick food-quality-analysis from — Load Example —, which also fills in the options.
- Set the Options and click Calculate.
- Use Download › to save the results as PDF, Word or Excel.
No account yet? Talk to us for a demo or a trial.
Options
Data and test settings
- Samples: the column or columns to test. Select one or more; each selected column is analyzed as a separate sample. Required.
- Confidence level: the confidence level of the interval for the mean, in percent, from 75 to 100. Default 95. A 95% level means that if you repeated the sampling many times, about 95% of intervals built this way would contain the true mean. A higher level gives a wider interval. The significance level is 1 − confidence level / 100, so 95 gives α = 0.05.
- Known standard deviation: the population standard deviation σ. It must be greater than 0. Required. The tool uses it for the standard error and does not estimate it from your data.
- Hypothesized mean: the target value of the mean under the null hypothesis, for example 15. The field's hint is "For hypothesis test". If you leave it blank, the tool gives only the interval and no test.
- Alternative hypothesis:
- Mean ≠ hypothesized mean (default): the mean differs from the target in either direction. Gives a two-sided interval.
- Mean < hypothesized mean: the mean is below the target. Gives an upper bound.
- Mean > hypothesized mean: the mean is above the target. Gives a lower bound.
Graphs
- Individual value plot: unticked by default. Plots every observation as a point.
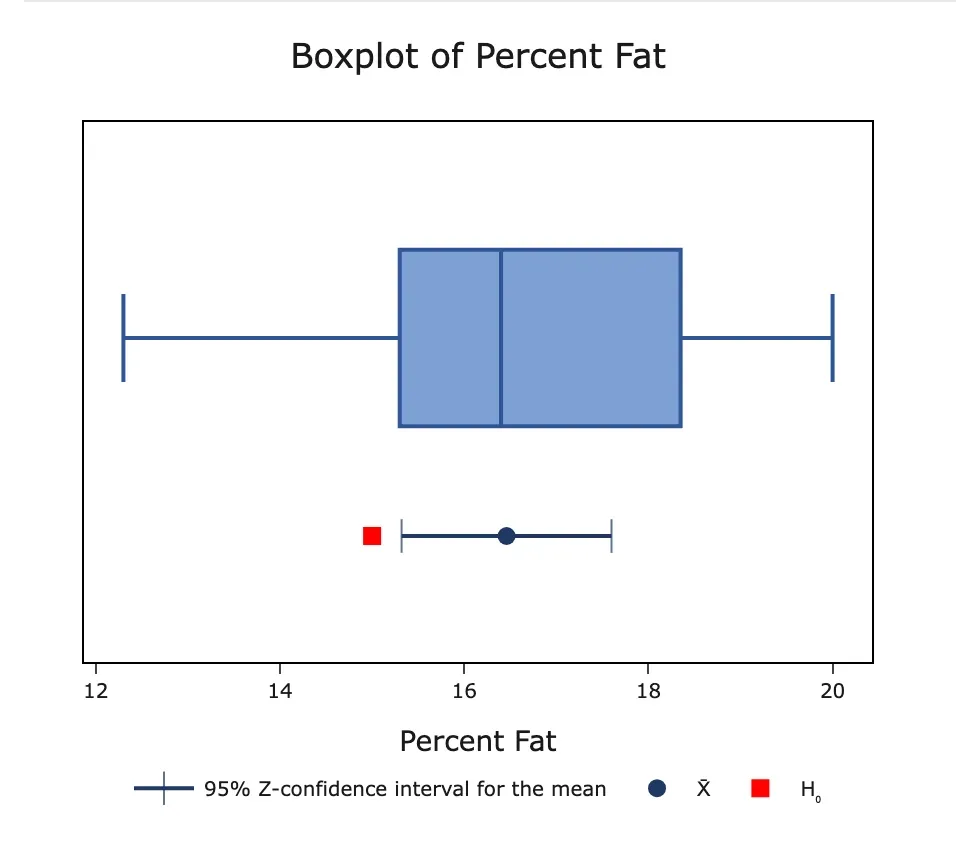
- Box plot: ticked by default. A box plot of the sample, with the sample mean (X̄), its confidence interval and the hypothesized mean (H₀) marked below it. When it is on, the tool also lists any outliers (values more than 1.5 × IQR beyond the quartiles).
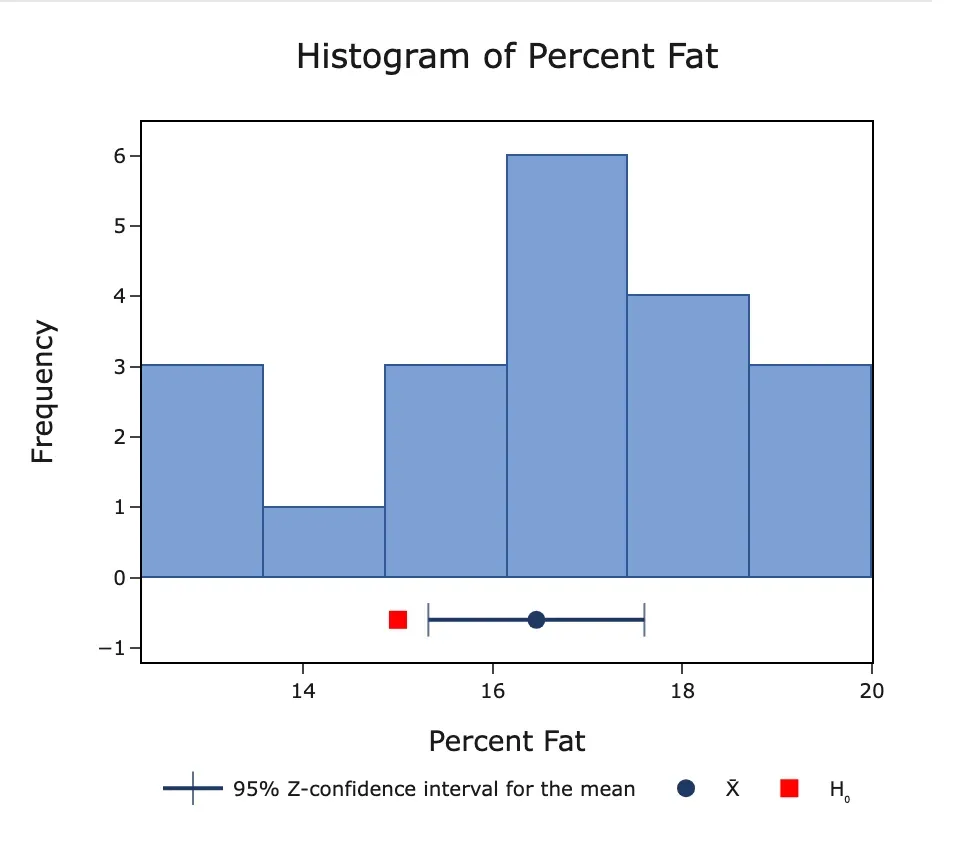
- Histogram: ticked by default. A histogram of the sample, with the same marks for X̄, its confidence interval and H₀.
- Label: extra labels on the box plot. Choose None (default), outliers, Individual Data, All Quartiles or Means.
Data Options: Subset
- Data Options: Subset: Exclude matching rows (default) or Include only matching rows. It applies to the rows matched by Row numbers: or Condition:, and has no effect if both are empty.
- Row numbers: optional. Grid row numbers to match, for example
3,7,12-15. - Condition: optional. A rule on column values, for example `
> 18. Combine conditions withand,orandnot`, put text values in quotes, and wrap column names that contain spaces in backticks. If both fields are filled in, a row matching either one is matched.
This tool has no guided interpretation option.
Output
The results show these parts, in this order.
- Box plot and Histogram, if ticked. If you selected several columns, there is a set of graphs for each column. The marks below the graph show the sample mean, its confidence interval and the hypothesized mean. If the interval does not reach H₀, the test will reject the null hypothesis.
- Estimation table: N, Mean, StDev and SE Mean, and the confidence interval for the mean. A two-sided test gives an interval such as "95% CI for M". A one-sided test gives a lower or upper bound instead. With several columns, there is one row per sample.
- Test (if you entered a hypothesized mean): the null hypothesis (H₀: μ = the hypothesized mean) and the alternative.
- Z-Value and P-Value: the test statistic and the p-value.
- The outliers list, if the box plot is on.
How to read it:
- SE Mean is the known σ divided by √n. StDev is the standard deviation of your sample, shown for information. The test does not use it.
- If the P-Value is less than your significance level (for example 0.05), reject the null hypothesis: the mean differs from the hypothesized value.
- The interval shows which values of the true mean are plausible. For a two-sided test it agrees with the test: it excludes the hypothesized mean exactly when the p-value is below α.
- If the sample StDev is very different from the known σ, check whether σ is still right for your process.


Worked example
This example uses the tool's own example dataset, food-quality-analysis, so you can reproduce it. On the tool page, pick food-quality-analysis from — Load Example — and click Calculate. The example fills in Samples = Percent Fat, Known standard deviation = 2.6 and Hypothesized mean = 15. The other options stay at their defaults, including Confidence level = 95 and Alternative hypothesis = Mean ≠ hypothesized mean.
A food company advertises 15% fat in its bottled sauce. A scientist measures the fat in 20 random bottles. From earlier work, the population standard deviation is known to be 2.6%. Does the average fat content differ from 15%?
Estimation
N | Mean | StDev | SE Mean | 95% CI for M |
|---|---|---|---|---|
20 | 16.46 | 2.2582 | 0.5814 | (15.3205, 17.5995) |
Test: H₀: μ = 15, H₁: μ ≠ 15
Z-Value | P-Value |
|---|---|
2.511 | 0.012 |
How to read it:
- The sample mean is 16.46%, which is 1.46 points above the label value.
- SE Mean is 2.6 ÷ √20 = 0.5814, so z = (16.46 − 15) ÷ 0.5814 = 2.511.
- The p-value, 0.012, is below 0.05. The average fat content differs from the advertised 15%, and it is higher.
- The 95% interval, 15.32 to 17.60, does not contain 15. The true average is probably between about 15.3% and 17.6%.
- The box plot and histogram show no outliers and no strong skew, which supports the test for a sample of 20.
- The sample standard deviation, 2.2582, is not used in the test. The test uses the known 2.6.
Try this: set Alternative hypothesis to Mean > hypothesized mean to ask whether the fat content is above 15%. The one-sided p-value is about 0.006, and the output gives a lower bound instead of an interval. For comparison, the One Sample T Test on the same data, which estimates the spread from the sample, gives a p-value of about 0.0094.
Frequently asked questions
What is a one-sample z-test?
It is a hypothesis test that compares the mean of one sample with a target value when the population standard deviation is known. It tells you whether the difference is statistically significant and gives a confidence interval for the true mean.
What is the difference between a z-test and a t-test?
The z-test uses a standard deviation you already know (σ). The t-test estimates it from the sample, which adds uncertainty and makes the intervals a little wider, especially for small samples. If you are not sure σ is known, use the One Sample T Test.
Where do I get the known standard deviation?
From a large body of earlier data on the same stable process, from a standard or specification, or from a measurement system study. Do not type in the standard deviation of the sample you are testing. That makes the p-value too optimistic.
How large must my sample be?
If the data are roughly normal, the test works for any sample size. If not, use more than 20 observations and check that the data are not strongly skewed.
What if I leave Hypothesized mean empty?
The tool then gives only the sample statistics and the confidence interval, with no test, z-value or p-value.
Can I test several columns at once?
Yes. Select more than one column in Samples. Each is tested separately against the same known standard deviation and hypothesized mean.